Break of Structure Examples: BOS vs CHoCH Trading Guide
Master break of structure examples with candle closure rules, order block retests, and BOS vs CHoCH frameworks to pass prop firm challenges.
If you open a financial chart for the first time, price movement looks like chaotic zig-zags. Green and red candles jump up and down with no apparent rhythm.
Most beginner traders stare at these candles, guess where the market might go, enter a trade with high leverage, and watch their account get liquidated within minutes.
Understanding market structure changes everything. Underneath the apparent chaos of candlestick charts lies an institutional game of liquidity and structural momentum known as Break of Structure (BOS).
When you learn to read a Break of Structure correctly, charts stop looking like random noise and start reading like a clear roadmap.
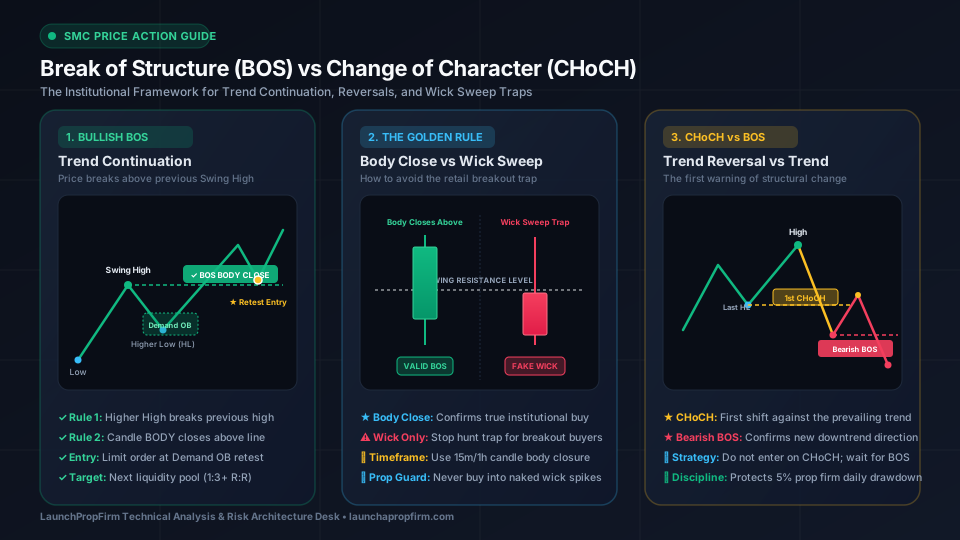
1. What Is a Break of Structure (BOS)? The Simple Staircase Analogy
To understand a Break of Structure, forget confusing institutional finance jargon for a moment. Think about something everyone knows: walking up and down a flight of stairs.
The Upward Staircase (Bullish Trend)
When you climb a staircase:
- Each step you step onto is higher than the last step you left behind. In trading, we call these Higher Highs (HH).
- The flat floor where you rest your back foot before pushing up again is also higher than the bottom. We call these Higher Lows (HL).
- Every single time your front foot steps onto a brand new, higher step, you have broken through the previous high level.
The Golden Definition of a Bullish BOS:
When the market is moving upward, creating higher peaks, and the price surges past the previous peak to create a brand new high, that breakthrough is a Bullish Break of Structure (Bullish BOS). It tells you the buyers are still firmly in charge and pushing the market upstairs.
The Downward Staircase (Bearish Trend)
When you walk down the stairs into a basement:
- Each downward step you land on is lower than the one above it. In trading, we call these Lower Lows (LL).
- Every time you lift your back foot from a higher step, that intermediate resting point is lower than the top floor. We call these Lower Highs (LH).
- Every single time your foot steps down onto a brand new, deeper step, you have broken through the previous floor.
The Golden Definition of a Bearish BOS:
When the market is moving downward, creating deeper troughs, and the price plunges past the previous bottom to create a brand new low, that breakdown is a Bearish Break of Structure (Bearish BOS). It proves sellers are overpowering buyers and driving price downstairs.
2. The Cardinal Rule: Candle Body Close vs Wick Rejection
Here is where 90% of beginner retail traders lose their hard-earned money and fail prop firm challenges.
They see a candlestick shoot past the previous high for two seconds, get excited, click "BUY" with market execution, and then watch the candle violently reverse, leaving behind a long thin upper wick and blowing their stop-loss.
To avoid falling into this retail trap, memorize The Glass Ceiling Analogy.
Imagine a room with a thick glass skylight on the ceiling:
- If a jumper leaps into the air, punches their fist through the skylight, but falls back down onto the floor, the ceiling was not conquered. The jumper is back inside the room. In trading, that is a wick rejection (liquidity sweep).
- If the jumper crashes straight through the glass, lands both feet on the roof outside, and stands up firmly, the ceiling has been permanently broken. In trading, that is a valid candle body close.
| Candlestick Feature | Valid Bullish BOS (True Breakout) | Wick Rejection / Liquidity Sweep (Retail Trap) |
|---|---|---|
| Candle Body Position | Closes completely above previous swing high | Closes back below previous swing high |
| Wick Behavior | Small or medium upper wick with strong body close | Long protruding upper wick (liquidity grab) |
| Volume & Momentum | Strong institutional volume absorbing all supply | Low absorption, aggressive counter-dump |
| Market Role | Trend continuation confirmed | Stop hunt / fakeout — reversal imminent |
| Trader Action | Wait for pullback to demand order block | Do NOT buy — prepare for short reversal |
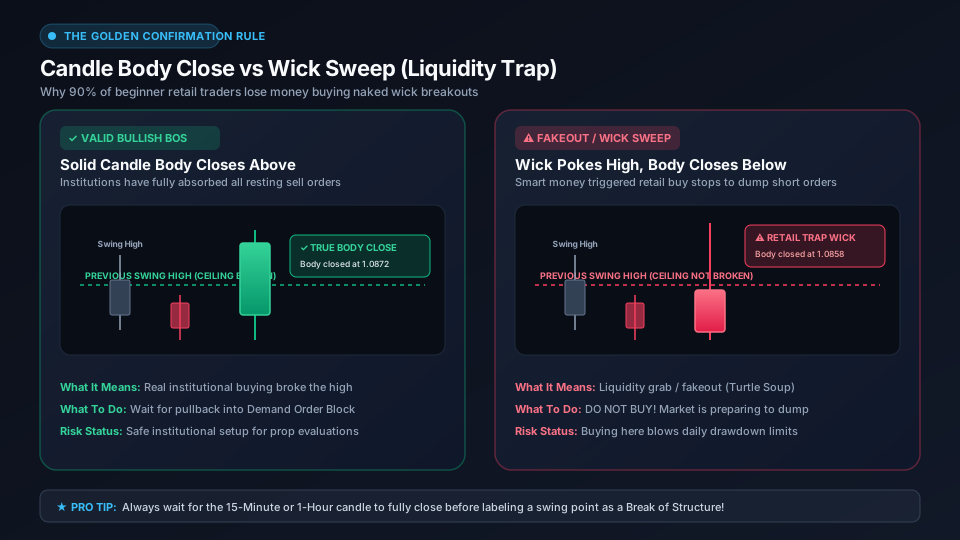
Pro Trader Rule of Thumb: "Wicks do the damage (hunt liquidity), but bodies tell the story (confirm structure)." If the solid candle body has not closed completely outside the swing point on your execution timeframe, the structure has NOT broken. Never enter a market order on a naked wick spike.
The Institutional Rule of Confirmation:
- Valid BOS: The closing price of the candlestick (the solid colored rectangle) must close completely beyond the swing high or swing low on your execution timeframe (typically the 15-minute or 1-hour chart).
- Invalid Fakeout (Liquidity Sweep): If only the thin needle (the wick) pokes past the level while the solid body closes back inside the previous range, smart money institutions have merely triggered retail breakout stop orders to fill their own counter-trend orders. Never enter a trade on a naked wick break.
3. Real-World Break of Structure Examples
Let us examine how this price action plays out on real trading charts across foreign exchange, commodities, and digital assets.
Example 1: Bullish BOS on EUR/USD (15-Minute Chart)
Suppose you are monitoring EUR/USD during the London morning trading session:
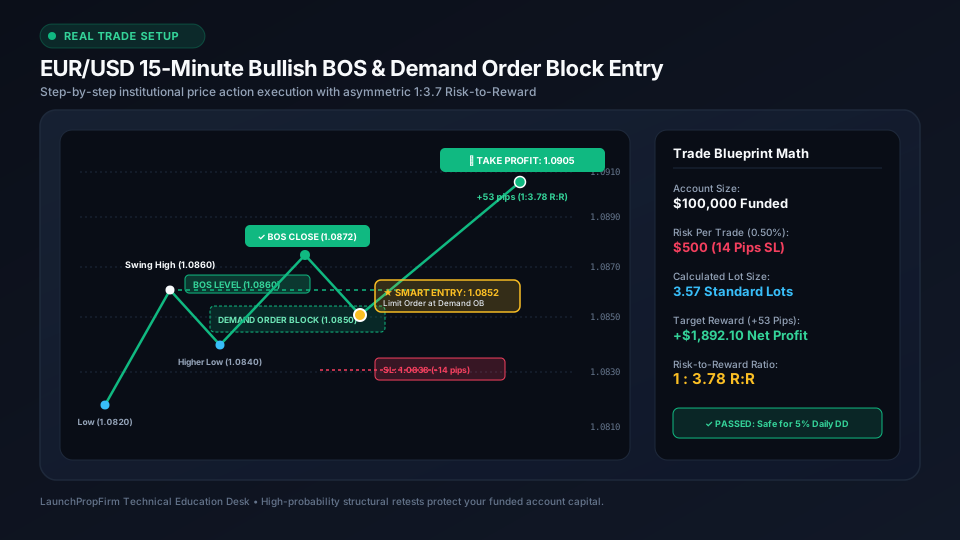
- The Setup: Price rallies from 1.0820 up to 1.0860 (Swing High #1).
- The Pullback: Sellers push price back down to 1.0840, forming a valid Higher Low.
- The Breakout: At 09:30 AM London time, strong economic news or institutional bank orders hit the market. A large green 15-minute candlestick surges through 1.0860 and closes its solid body at 1.0872.
- The BOS Confirmation: The moment that 15-minute candle closes at 1.0872, an institutional Bullish BOS is confirmed. You now know with high statistical probability that EUR/USD intends to trend higher.
- The Smart Entry: Beginners buy at 1.0872 (at the very top). Professional prop traders wait patiently for price to pull back and retest the originating Demand Order Block at 1.0850.
- Risk-to-Reward Execution: You place a limit buy order at 1.0852, set your protective stop loss at 1.0838 (14 pips risk), and target the next major daily resistance at 1.0905 (53 pips reward). That provides an asymmetric 1:3.7 Risk-to-Reward ratio.
Example 2: Bearish BOS on Gold (XAU/USD)
Gold is famous for violent liquidity sweeps that wipe out uneducated retail traders:
- The Setup: Gold trades in an Asian session range between $2,640 and $2,655. The swing low sits at $2,640.
- The Fakeout: At the London open, a sudden 5-minute red spike pushes down to $2,637, but snaps right back up to close at $2,643. Beginners who sold the breakdown are trapped.
- The True Bearish BOS: Forty minutes later, heavy institutional selling enters the market. A full 1-hour candle prints with open at $2,644 and closes firmly at $2,632.
- Confirmation: Because the solid candle body closed well below the $2,640 structural floor, a Bearish BOS is printed.
- Execution: You set a pending limit sell order at the mitigation retest level of $2,638, risk $4 on your stop loss ($2,642), and target $2,618 for a clean 1:5 R:R winning trade.
Skip the monthly fees
Own your prop firm platform outright. One time purchase.
Full source code. Live in 7 days. No revenue share. No monthly SaaS bill. See the exact platform before paying anything.
Demo login: haris / asdf1122. No signup needed
4. Break of Structure (BOS) vs Change of Character (CHoCH)
Many traders use the terms BOS and CHoCH interchangeably, which leads to catastrophic trading errors. They are two completely different phases of market structure:
| Technical Feature | Break of Structure (BOS) | Change of Character (CHoCH) |
|---|---|---|
| Market Role | Trend Continuation (The trend goes on) | Trend Reversal (The trend is shifting) |
| Previous Structure | Confirms prevailing Higher Highs or Lower Lows | Breaks the opposite structural point |
| Entry Psychology | Adding to existing momentum on pullbacks | Catching the very first shift of a new trend |
| Failure Rate | Low (Trading with the dominant macro trend) | Moderate (Early reversal attempts can fail) |
| Best Confirmation | Retest of originating Order Block (OB) | Secondary BOS in the new trend direction |
How to Tell Them Apart on Your Screen
- If the market is going UP (making Higher Highs and Higher Lows), and it breaks another HIGH, that is a BOS. The bullish train is simply stopping at the next station.
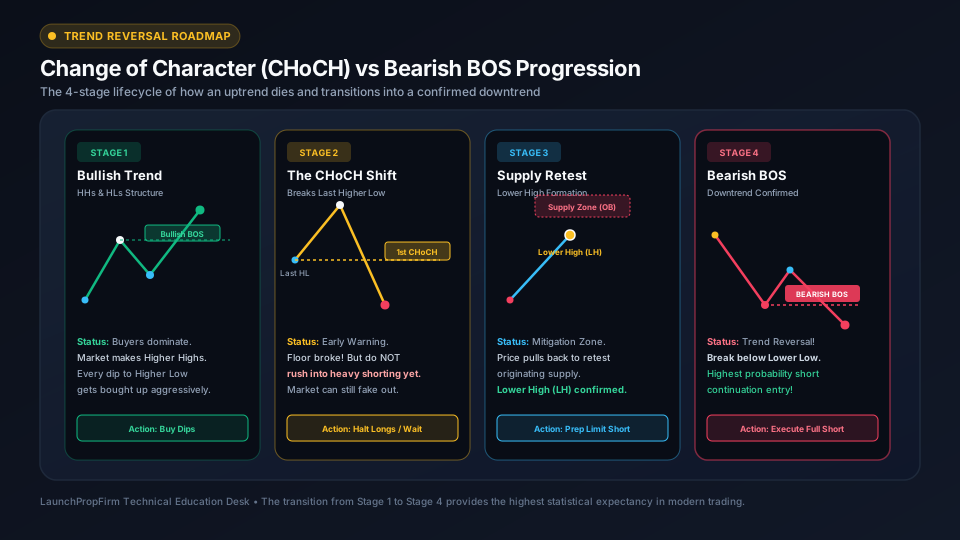
- If the market is going UP, but suddenly plummets and breaks below the most recent Higher Low, that is a CHoCH. The market has "changed its character." The buyers who defended the previous floor have surrendered, warning you that a downtrend may be starting.
- The Professional Rule: Never enter maximum lot size on a lone CHoCH. Wait for the market to form its first Lower High, break down into a Bearish BOS, and then execute your short position on the retest.
5. How Prop Firm Traders Use BOS to Protect Daily Drawdown
In retail prop trading evaluations (such as funded accounts on Forex, CFDs, and crypto), the single biggest risk is not making profit; it is violating your maximum 5% daily drawdown limit.
When you chase breakouts blindly, you enter at the absolute exhaustion point of a price wave. If price pulls back 30 pips to test its Order Block before continuing upward, a market-order breakout buyer is holding a massive floating loss that can trigger an automated account breach.
The 4-Step BOS Execution Protocol for Funded Accounts:
- Identify the Higher Timeframe Bias: Open the 4-Hour or 1-Hour chart to determine whether the macro structure is printing Bullish BOS or Bearish BOS. Never trade against Higher Timeframe structure.
- Wait for the Lower Timeframe BOS: Drop down to the 15-Minute or 5-Minute chart. Let the price break swing structure with a confirmed candle body close.
- Calculate Exact Pip Risk: Never guess your lot size. Use our free institutional Prop Firm Lot Size Calculator to size your position so that your stop loss represents strictly 0.50% to 1.0% of your evaluation balance.
- Log the Retest in Your Journal: Wait for price to return to the Discount Zone (below 50% equilibrium of the impulse leg). Record the setup in our Professional Trading Journal Workbook (.xlsx) to track your structural win rate and R-multiples over time.
6. The Operator Perspective: How Prop Firms Manage Clustered BOS Exposure
Why do proprietary trading firms care so deeply about how retail traders execute Break of Structure setups?
Because retail traders across the globe read the exact same technical charts. When EUR/USD or Bitcoin prints a textbook 1-Hour Bullish BOS, thousands of challenge traders simultaneously place limit buy orders at the exact same Demand Order Block level.
The Backend Risk Mechanics:
- Order Flow Clustering: If 300 funded traders enter identical 5-lot buy orders on EUR/USD at 1.0850, the prop firm suddenly carries 1,500 lots ($150,000,000 notional exposure) at a single price tick.
- B-Book vs A-Book Hybrid Routing: Prop firm operators using legacy SaaS platforms (like FPFX or Propriotec) pay hefty volume commissions and lack the granular automated controls to split this risk. If the BOS trade runs 100 pips into profit, the firm faces a massive simultaneous payout liability.
- The LaunchPropFirm Architectural Solution: Founders deploying our turnkey, self-hosted white label prop firm platform ($2,495 one-time purchase with full Next.js/Node.js source code ownership and zero monthly SaaS rent) utilize our built-in AI Sentinel V11.5.
- The Sentinel monitors real-time order clustering on MetaTrader 5, cTrader, and TradingView bridges. It automatically distinguishes legitimate price-action swing traders honoring consistency rules from synchronized latency arbitrage bots, allowing operators to dynamically copy high-alpha BOS traders straight onto institutional A-Book Prime of Prime liquidity feeds.
7. Confused About a Chart Setup? Ask Us Directly!
Trading market structure sounds simple on paper, but when live market candles are printing rapidly during high-impact news, identifying the real swing points can feel overwhelming.
Still Unsure If a Specific Wick Counts as a BOS?
Did your favorite currency pair or index just print a confusing wick on the 15-minute chart? Are you wondering whether your setup qualifies as a confirmed BOS or a dangerous liquidity sweep before you risk your funded account?
Reach out directly to our Trading Architecture Desk on WhatsApp (+92 315 8583905) or drop your question in our community channels. Send us your TradingView chart screenshot and our risk engineers will walk you through the structural swing points step-by-step for free!
Frequently Asked Questions
What is the exact difference between Break of Structure (BOS) and Change of Character (CHoCH)?
A Break of Structure (BOS) indicates trend continuation in the direction of the existing trend (e.g. price breaking above a previous Higher High in an uptrend). A Change of Character (CHoCH) represents an initial trend reversal warning, occurring when price breaks the opposite structural level (e.g. price breaking below the most recent Higher Low in an uptrend).
Does a valid Break of Structure require a full candle body close or just a wick break?
Institutional market structure confirmation strictly requires a full candle body close beyond the swing high or swing low on your execution timeframe. A wick extending past the level with a body closing back inside the range is classified as a liquidity sweep (stop hunt) and indicates potential price reversal rather than continuation.
How do funded prop traders use BOS without blowing daily drawdown limits?
Funded challenge traders protect their daily drawdown limits by never market-buying the initial breakout candle. Instead, they wait for price to print a confirmed candle body BOS, calculate position size to risk strictly 0.50% to 1.0% using a lot size calculator, and enter on a limit order when price pulls back to retest the originating Order Block or Fair Value Gap.
What is a fake break of structure (liquidity sweep)?
A fake break of structure occurs when large institutional market participants deliberately push price just past an obvious swing high or swing low to trigger retail breakout orders and stop-loss pools. Once this liquidity is absorbed, institutions reverse price aggressively in the opposite direction, leaving behind a long rejection wick on the candlestick.
Written by the LaunchPropFirm Technical Analysis & Risk Architecture Desk.
Calculate SaaS Monthly Rent vs 1-Time Code Ownership
SaaS prop firm providers charge $2,500/mo plus 8% revenue share. Compare 12-month total expenses vs 100% source code ownership.

M.Haris
Founder & Platform ArchitectBuilding open prop trading software infrastructure for operators worldwide
I built LaunchPropFirm to give forex educators, trading communities, and fintech operators complete ownership of their platform with full source code and zero monthly SaaS rent. Every article on this blog is drawn from hands-on platform development, live MT5 risk bridge mechanics, and real operator economics.
All content, financial models, ROI estimates, and architecture guides on LaunchPropFirm are published strictly for educational and informational purposes. LaunchPropFirm provides institutional prop trading software and technology infrastructure; it does not operate as a broker, custodian, or registered investment advisor.
Evaluation challenges and funded trader accounts referenced in this guide operate in simulated demo trading environments using real-time market data feeds. Simulated trading results do not represent actual trading performance or financial advice.
Recommended Next Reads
Hand-picked operator guides to scale your prop trading platform.
Is Day Trading Hard? Why 95% Fail & The Math Explained
Discover why 95% of day traders fail, the mathematical reality of leverage drag, and how funded evaluation accounts cap your personal downside risk.
How Much Money to Start Day Trading? 2026 Capital Guide
How much money do you need to start day trading in 2026? Compare $25k PDT rules, $500 personal accounts, and prop firm leverage with real risk math.
Skip the monthly fees
Own your prop firm platform outright. One time purchase.
Full source code. Live in 7 days. No revenue share. No monthly SaaS bill. See the exact platform before paying anything.
Demo login: haris / asdf1122. No signup needed