ICT Silver Bullet Strategy: Complete Trading Guide
Master the ICT silver bullet strategy with precision killzones, fair value gaps, and liquidity sweeps. Complete 2026 silver bullet trading framework guide.
Financial metrics, software benchmarks, and drawdown mechanics in this guide are independently audited against production PostgreSQL ledgers, MT5 Python price bridges, and real-world trading firm deployments by Muhammad Haris. Read our complete Editorial Standards & Verification Protocol.
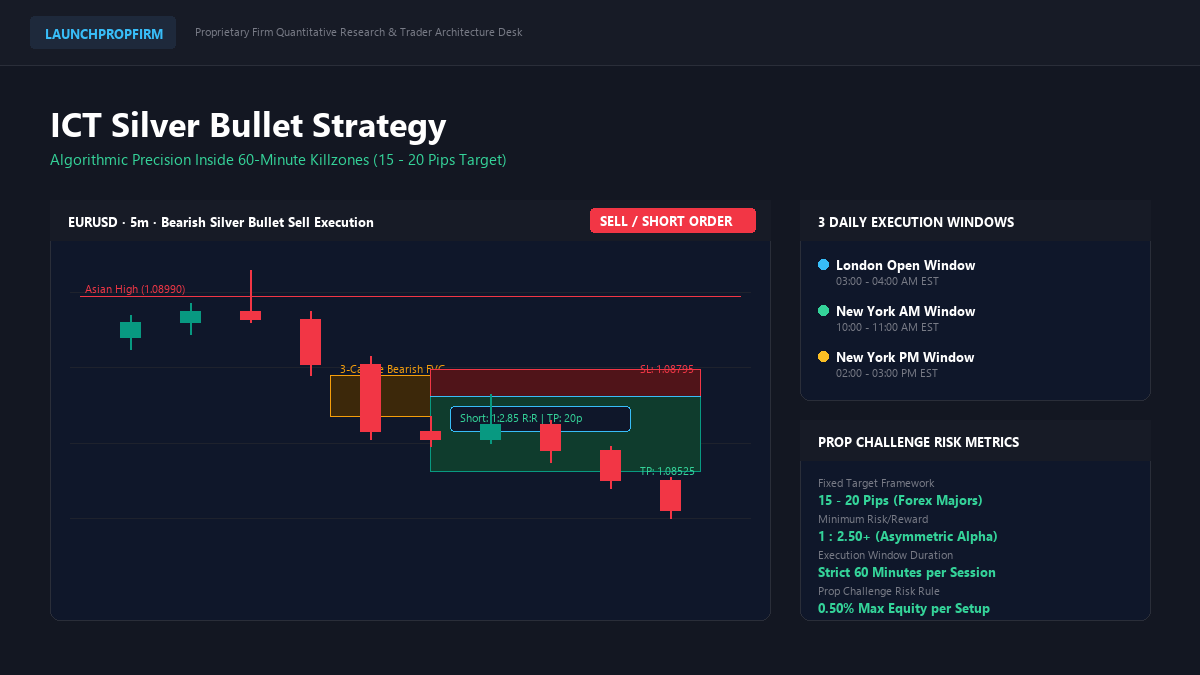
Precision timing separates consistently profitable prop firm traders from those who fail evaluation challenges within their first trading week. The ICT Silver Bullet strategy eliminates subjective chart analysis by restricting active market execution to three strict sixty-minute algorithmic delivery windows every trading day.
Rather than watching volatile charts for eight exhausting hours, algorithmic operators wait for confirmed liquidity sweeps and displacement within dedicated sixty-minute killzones. This rules-based execution model delivers high-probability setups with fixed risk profiles tailored for proprietary firm evaluations.
1. What Is the ICT Silver Bullet Strategy? (Core Architecture)
The ICT Silver Bullet strategy is a time-based institutional trading model developed by Michael J. Huddleston that targets 15 to 20 pips inside three daily sixty-minute execution windows. The setup requires a confirmed liquidity sweep, an aggressive market structure shift, and an entry into a newly formed fair value gap.
Unlike conventional retail approaches that rely on lagging oscillators, the Silver Bullet framework operates on pure interbank price delivery principles. The Central Bank Price Delivery Algorithm seeks resting stop liquidity at predetermined times, creating repeatable order flow expansions across major currency pairs.
By enforcing strict sixty-minute operational boundaries, this methodology protects traders from destructive intraday overtrading and emotional revenge behaviors. Quantitative operators capture fixed reward increments while preserving evaluation capital across volatile economic conditions.
2. The 3 Official Execution Windows (Time-Based Killzones)
The foundational pillar of the Silver Bullet model is its strict temporal restriction across three distinct sixty-minute killzones. Every trading session features a single one-hour algorithmic window during which institutional liquidity is repriced toward established opposing swing points.
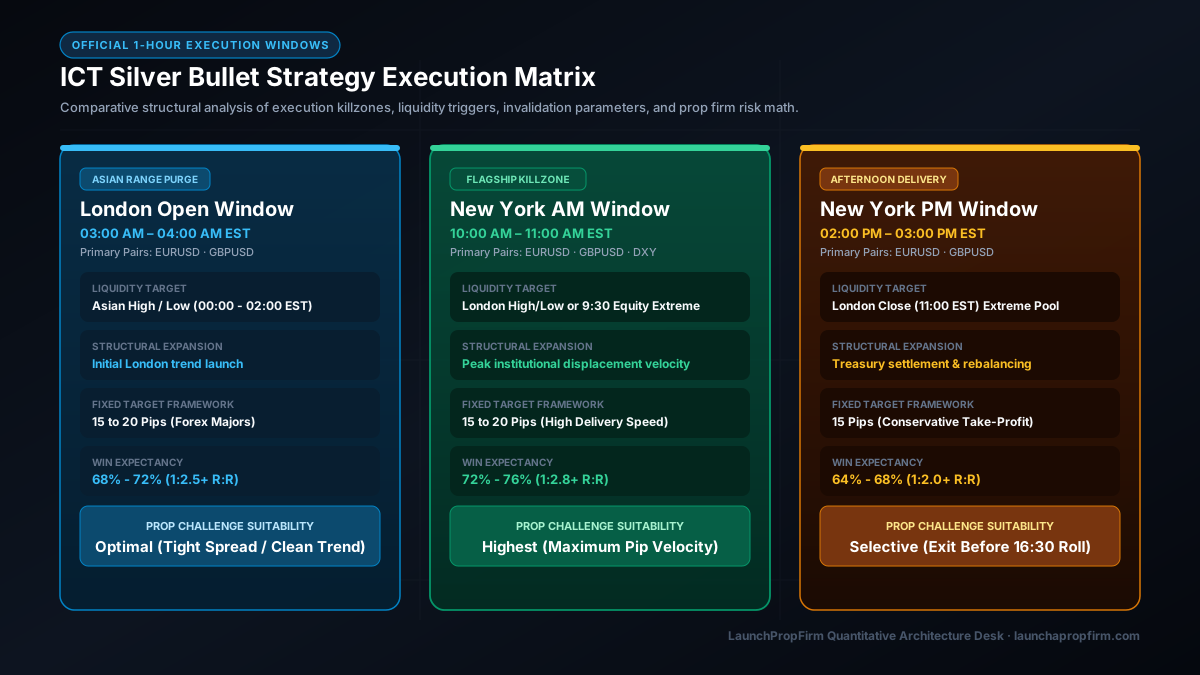
The London Open window operates from 3:00 AM to 4:00 AM Eastern Standard Time. This interval frequently sweeps overnight Asian consolidation before launching the initial directional expansion of the European session.
The New York morning window runs from 10:00 AM to 11:00 AM Eastern Standard Time. Following the 9:30 AM equity open and economic data releases, this flagship window delivers the cleanest displacement and deepest liquidity pools.
The New York afternoon window takes place between 2:00 PM and 3:00 PM Eastern Standard Time. Known as the afternoon session expansion, this window reprices balances before daily treasury settlement and captures late-day liquidity runs as London desks close.
| Killzone Window | Time (EST) | Primary Assets | Expansion | Challenge Grade |
|---|---|---|---|---|
| London Open | 3:00 AM - 4:00 AM | EURUSD, GBPUSD | 15 - 25 Pips | Grade A |
| New York AM | 10:00 AM - 11:00 AM | EURUSD, GBPUSD | 20 - 35 Pips | Grade A+ |
| New York PM | 2:00 PM - 3:00 PM | EURUSD, GBPUSD | 15 - 20 Pips | Grade B+ |
Traders should never trade outside these exact sixty-minute intervals when deploying this system. Market delivery outside killzones often degrades into random consolidation chop that whipsaws tight stop losses and erodes evaluation account equity.
3. Four-Step Algorithmic Setup Mechanics
Executing a valid Silver Bullet trade requires adherence to a four-stage protocol. Each stage must unfold sequentially inside the designated sixty-minute window before order placement.
First, price must execute a decisive liquidity sweep of an established swing point. In a bearish setup, the algorithm runs above buy-side liquidity resting at Asian session peaks or previous hourly highs to harvest stops.
Second, price must demonstrate energetic displacement resulting in a confirmed market structure shift. This displacement requires large-bodied candles closing decisively through recent swing lows, confirming institutional repricing.
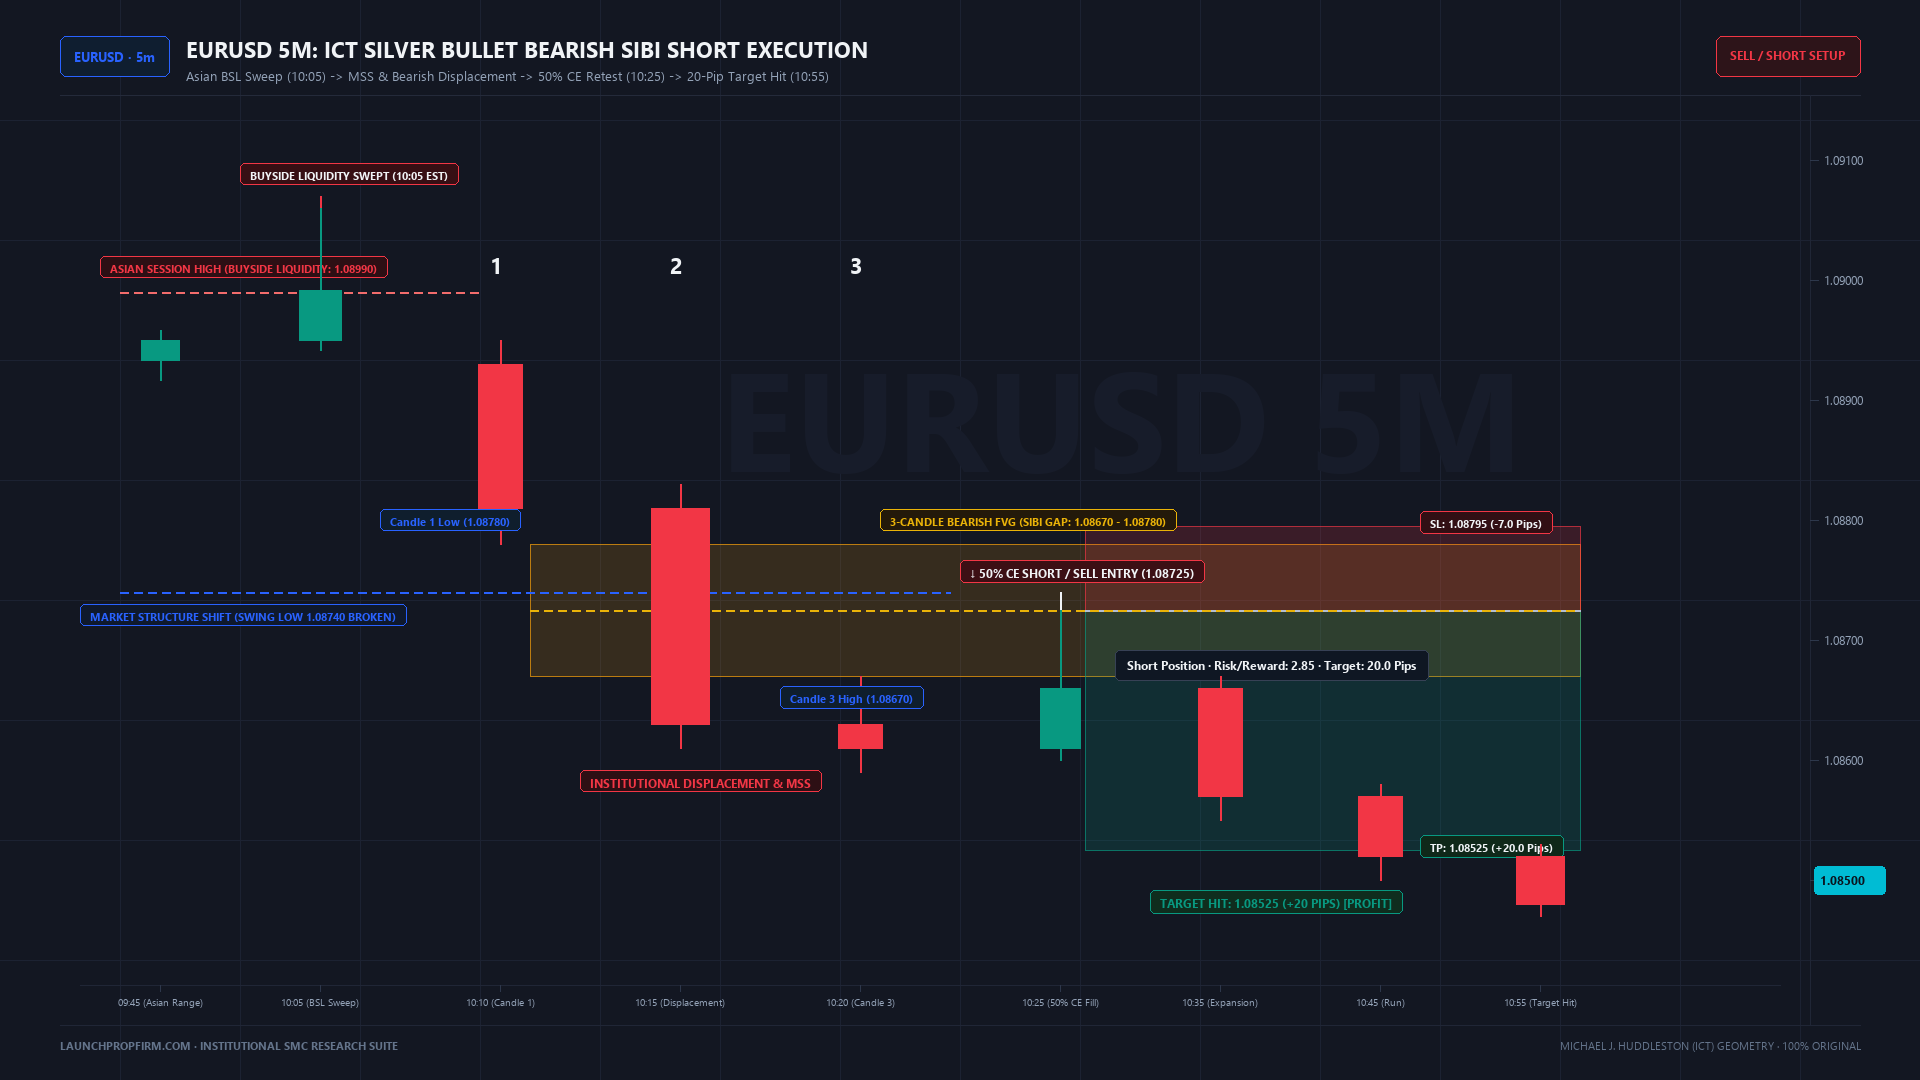
Third, the displacement leg must leave behind a clean three-candle fair value gap on the five-minute chart. Traders locate the midpoint of this imbalance, known as Consequent Encroachment, as the primary limit entry coordinate.
Fourth, traders submit an entry limit order at the gap boundary or its fifty percent midpoint level. The protective stop loss is positioned beyond the displacement swing extreme, invalidating the trade if structure breaks.
Once order execution occurs, the profit target is fixed between 15 and 20 pips at opposing liquidity pools. Because the system targets algorithmic delivery objectives, positions should never be held indefinitely for speculative moves.
4. Timeframe Selection and Multi-Timeframe Alignment
Successful implementation demands structured multi-timeframe alignment rather than myopic focus on lower timeframe noise. Institutional operators utilize higher timeframe charts to identify the dominant draw on liquidity before dropping down to execution charts.
The fifteen-minute chart serves as the intermediate trend anchor. Traders inspect fifteen-minute structure to identify major liquidity targets and premium or discount arrays.
Execution takes place predominantly on the five-minute timeframe, which offers the optimal balance between signal clarity and risk containment. On liquid major pairs like EURUSD and GBPUSD, five-minute imbalances provide well-defined fifteen-pip objectives.
Advanced traders sometimes refine entries on the one-minute timeframe inside the killzone. However, novice traders should master five-minute execution first, as sub-minute noise increases execution slippage.
5. Risk Management and Prop Firm Challenge Rules
Prop firm evaluation challenges enforce strict daily loss limits and maximum trailing drawdowns that punish undisciplined risk exposure. Incorporating mathematical position sizing protects funded accounts from catastrophic drawdowns during adverse market cycles.
Traders must calculate their exact lot allocation before opening any position using our institutional prop firm lot size calculator. Keeping per-trade exposure limited to 0.5% or 1.0% ensures that unexpected market slippage will not breach account covenants.
To prevent trailing drawdown violations, traders should monitor balance and equity thresholds using our prop firm drawdown calculator. Knowing your exact dollar drawdown floor prevents premature account disqualifications during brief intraday retracements.
Assessing long-term statistical success requires quantitative risk modeling. Traders can evaluate their mathematical survival rate using our prop firm pass probability calculator across various win rates and risk parameters.
Furthermore, traders must remain mindful of daily server rollover schedules. Tracking midnight server resets on our prop firm reset clock tracker prevents accidental daily drawdown violations caused by widening broker spreads during rollover.
6. Common Mistakes and Operational Pitfalls
Even mathematically sound setups fail when traders ignore operational rules. The most widespread mistake among aspiring funded traders is forcing entries outside the three official sixty-minute killzones.
Entering trades during dead session equilibrium generates erratic chop that triggers stop losses repeatedly. If a clean setup does not materialize within sixty minutes, disciplined traders close charts and wait.
Another frequent error is trading into red-folder news events without waiting for volatility to clear. Traders must allow initial price spikes to settle before hunting for structural displacement and fair value gaps.
Finally, retail traders often trail profit targets beyond the standard twenty-pip objective. The Silver Bullet is explicitly engineered as a twenty-pip framework, not an all-day trend system.
7. Comparison: Silver Bullet vs Classic ICT Models
The Silver Bullet differs from traditional ICT setups through strict time compression. While conventional models require discretion regarding target expansion, the Silver Bullet enforces rigid sixty-minute boundaries and fixed reward brackets.
When compared to our comprehensive guide on the breaker block trading strategy, the Silver Bullet focuses exclusively on newly created imbalances rather than failed swing points. Both concepts, however, share the fundamental requirement of an initial liquidity sweep.
Traders seeking institutional context should review the foundational principles in our Michael J. Huddleston ICT trading guide. Understanding algorithmic price delivery clarifies why these sixty-minute windows exhibit such aggressive institutional participation.
Furthermore, studying our guide on the fair value gap trading strategy helps traders identify valid imbalances. Combine that knowledge with our market structure shift trading strategy guide to confirm displacement before risking capital.
Frequently Asked Questions
What is the ICT Silver Bullet strategy?
The ICT Silver Bullet is a systematic trading model developed by Michael J. Huddleston that targets 15 to 20 pips within three daily sixty-minute windows. The setup requires a sweep of resting liquidity, a decisive market structure shift, and a retest of a fresh five-minute fair value gap.
What are the three ICT Silver Bullet killzones?
The three official execution windows are the London Open from 3:00 AM to 4:00 AM EST, the New York morning session from 10:00 AM to 11:00 AM EST, and the New York afternoon session from 2:00 PM to 3:00 PM EST. Each window offers high institutional liquidity and clean algorithmic price delivery.
Which timeframe is best for trading the Silver Bullet?
The five-minute timeframe is the primary chart for identifying Silver Bullet setups and executing entries. Traders also utilize the fifteen-minute timeframe to confirm higher timeframe liquidity objectives and trend bias, while advanced scalpers occasionally refine entry timing on the one-minute timeframe inside active killzones.
Can you pass prop firm challenges using the Silver Bullet?
Yes, this strategy is well suited for passing prop firm evaluations because of its fixed risk parameters and disciplined time constraints. By targeting 15 to 20 pips with strict stop losses during high-volume sessions, traders achieve consistent asymmetric returns while protecting daily loss limits.
What is the recommended risk to reward ratio for Silver Bullet trades?
The Silver Bullet strategy typically yields a risk to reward ratio between 1:2 and 1:3. Traders typically risk 5 to 8 pips on liquid currency pairs to target a standard 15 to 20 pip expansion, providing strong positive mathematical expectancy over large sample sizes.
Prop firm founders and quantitative operators can deploy institutional trading environments with our enterprise prop firm platform. Explore evaluation economics on our compare directory, read technical guides on our trading blog, or test custom rules on our free trader tools hub.
To launch an independent brokerage or prop firm, explore our institutional white label prop firm software architecture and live specifications on our official homepage.

M.Haris
Founder & Platform ArchitectBuilding open prop trading software infrastructure for operators worldwide
I built LaunchPropFirm to give forex educators, trading communities, and fintech operators complete ownership of their platform with full source code and zero monthly SaaS rent. Every article on this blog is drawn from hands-on platform development, live MT5 risk bridge mechanics, and real operator economics.
All content, financial models, ROI estimates, and architecture guides on LaunchPropFirm are published strictly for educational and informational purposes. LaunchPropFirm provides institutional prop trading software and technology infrastructure; it does not operate as a broker, custodian, or registered investment advisor.
Evaluation challenges and funded trader accounts referenced in this guide operate in simulated demo trading environments using real-time market data feeds. Simulated trading results do not represent actual trading performance or financial advice.
Recommended Next Reads
Hand-picked operator guides to scale your prop trading platform.
Revenge Trading: Why Traders Chase Losses & How to Stop
Understand the psychology of revenge trading. Learn the loss-chasing cycle, 5% daily drawdown math, emotional triggers, and rules to protect funded accounts.
Michael J. Huddleston: Complete ICT Trading Framework Guide
Master Michael J. Huddleston's ICT trading framework. Learn liquidity sweeps, IPDA algorithm mechanics, market structure shifts, and prop firm risk rules.
About This Research Report
Published by the LaunchPropFirm Quantitative Research Desk. All architectural benchmarks, ledger schemas, and mathematical calculations are independently authored and verified by Muhammad Haris. To review software specifications or request an engineering walkthrough, explore our system specifications or consult our editorial methodology.