Market Structure Shift: Complete MSS Trading Strategy
Master the market structure shift (MSS) trading strategy. Learn MSS vs BOS mechanics, candle body close rules, displacement FVGs, and prop firm risk math.
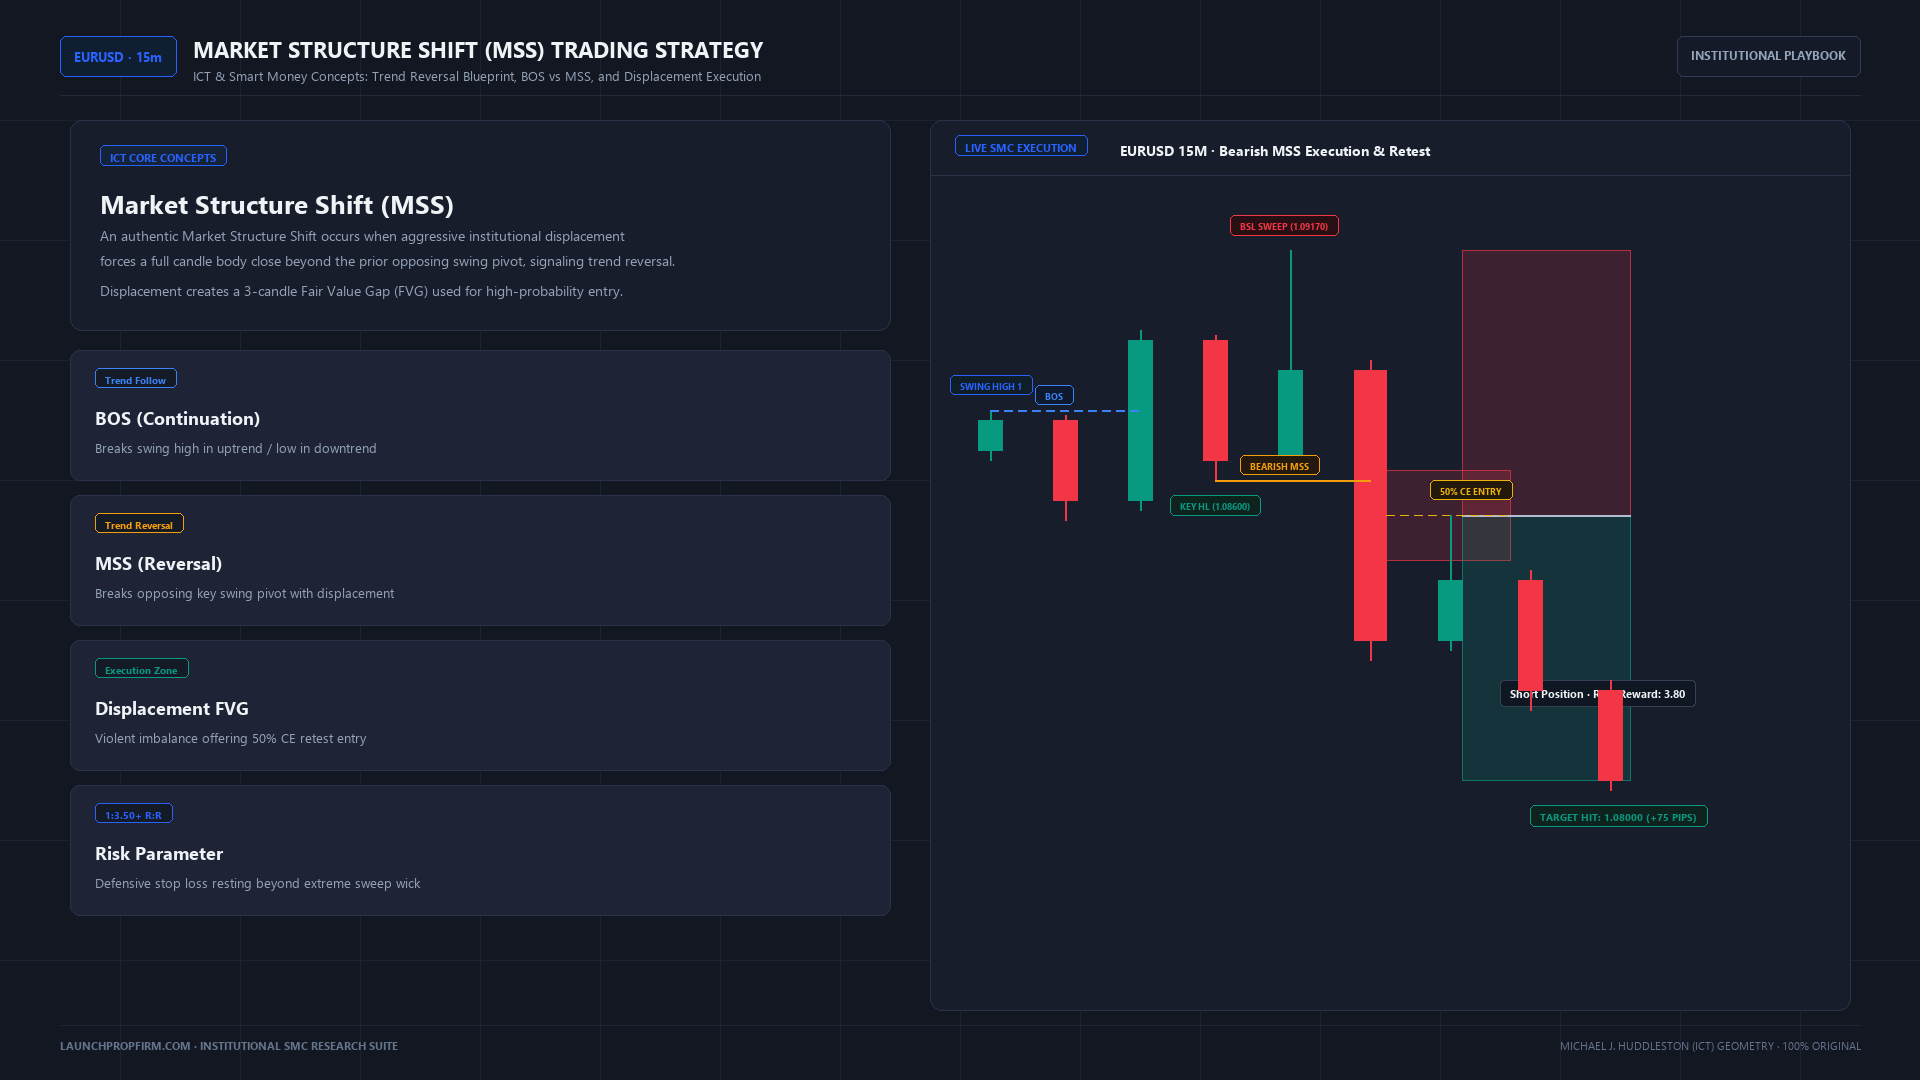
When institutional volume moves markets, retail support levels fail. Trading desks navigate trend reversals by identifying explosive shifts in order flow known as market structure shifts.
An authentic market structure shift occurs when displacement closes beyond a swing pivot. This confirms algorithmic order flow reversal, creating high-probability trade setups.
1. What is a Market Structure Shift? (ICT & SMC Reversal Mechanics)
A Market Structure Shift (MSS) is an institutional pattern where price breaks and closes beyond a prior structural swing high or low following a liquidity sweep. This violation signals that algorithms have shifted delivery direction from accumulation to distribution, or from distribution to accumulation.
Unlike a break of structure in forex signaling trend continuation, an MSS represents trend reversal. Sweeping liquidity engineers counter-party volume, trapping breakout traders offside.
Before executing reversal setups, calculate risk parameters with our prop firm lot size calculator. Defensive sizing protects equity against consecutive losses.
2. MSS vs BOS: The Critical Structural Difference
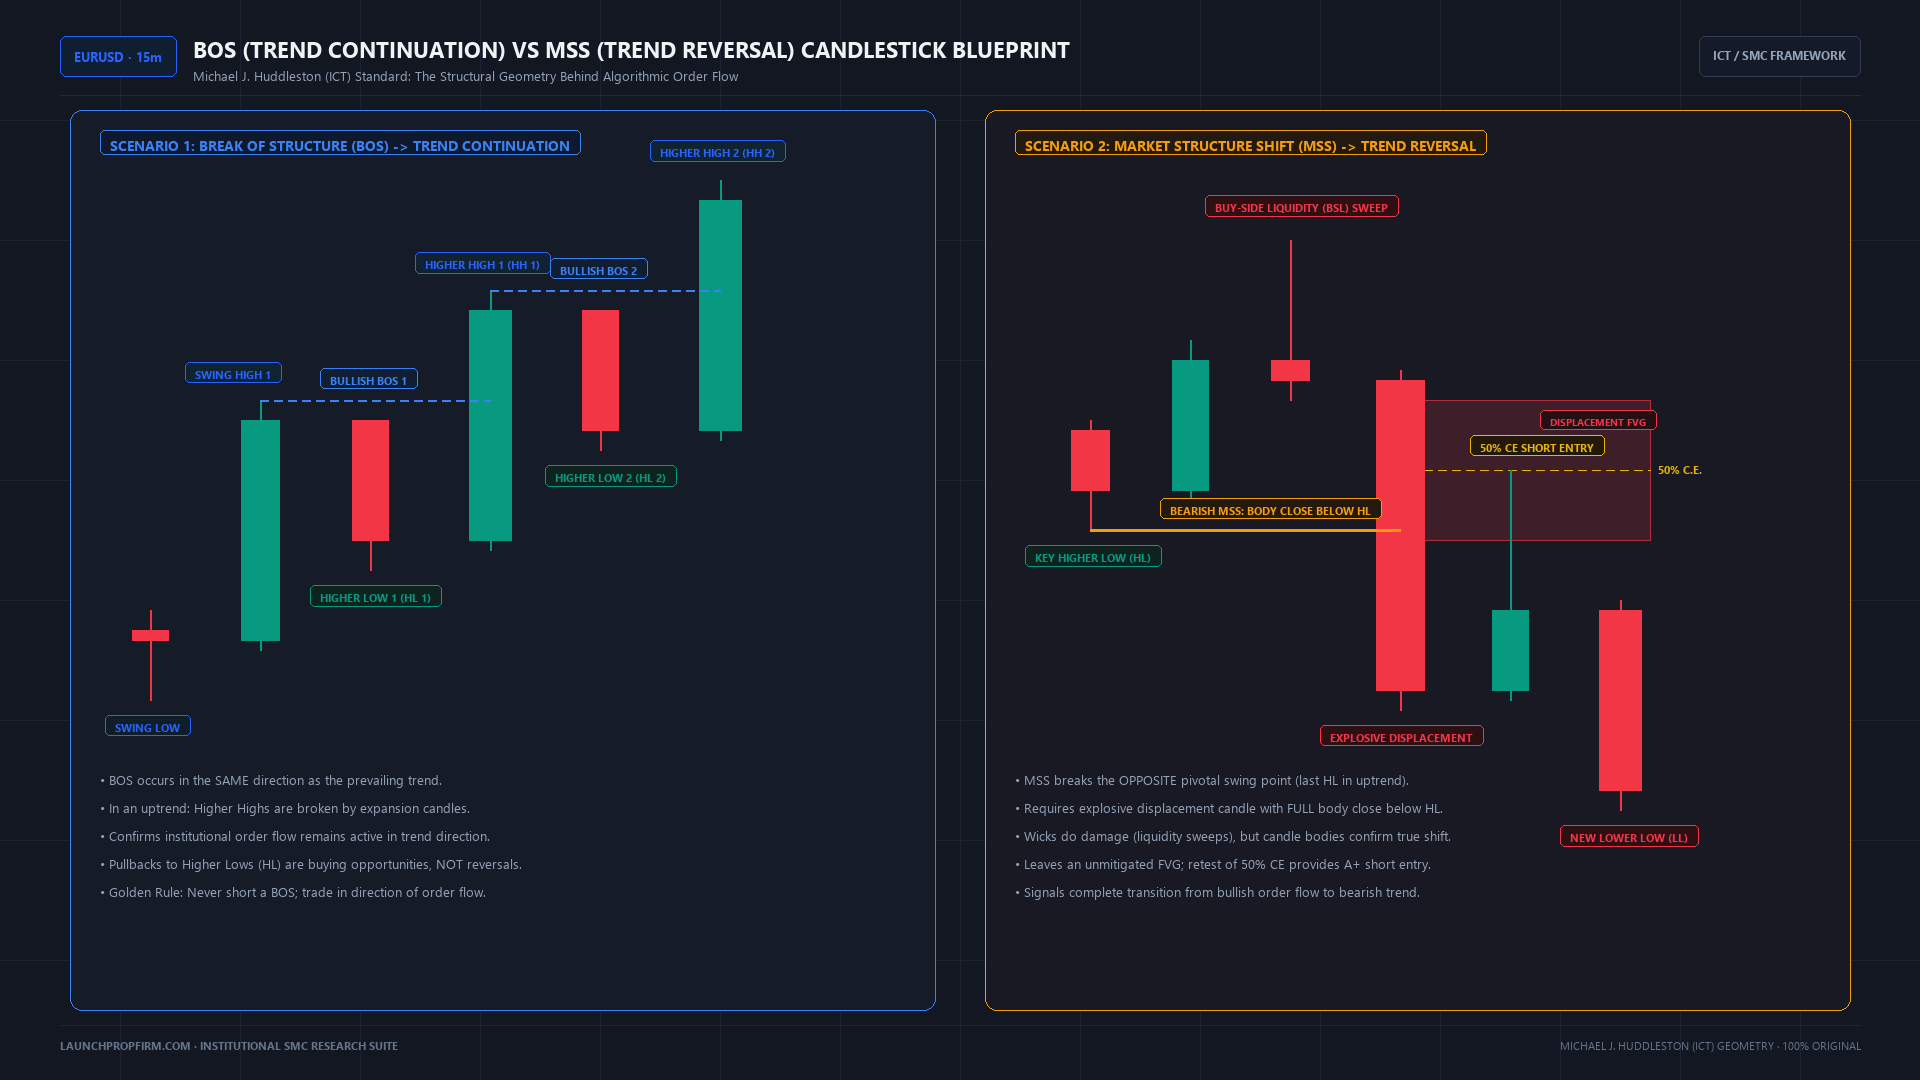
The difference between a Market Structure Shift (MSS) and a Break of Structure (BOS) lies in market direction. A Break of Structure confirms trend continuation by printing successive higher highs or lower lows. In contrast, a Market Structure Shift signals an authentic trend reversal by breaking opposing swing structure with displacement.
| Structural Feature | Break of Structure (BOS) | Market Structure Shift (MSS) |
|---|---|---|
| Operational Intent | Trend Continuation | Trend Reversal / Character Flip |
| Prior Liquidity Event | Normal Retracement inside Trend | Opposing External Liquidity Sweep |
| Candle Signature | Steady Momentum Close | Violent Displacement leaving FVG |
| Invalidation Level | Most Recent Swing Pivot | Liquidity Sweep Extreme Wick |
| Trade Execution | Pro-Trend Pullback Entry | Discount or Premium Reversal Retest |
| Win Rate in Trends | 68% to 74% in Aligned Trends | 72% to 78% after Macro Sweeps |
In an uptrend, a Break of Structure prints when price makes a new higher high. Retracements into an order block trading strategy zone offer reliable continuation entries.
An MSS sweeps external liquidity before displacement breaks the swing low, shattering structural continuity.
3. Bearish vs Bullish MSS: The 4-Point Anatomical Blueprint
Bullish and bearish market structure shifts operate through inverted institutional mechanics. A Bearish MSS sweeps buy-side liquidity before printing an explosive downward rupture through a swing low. A Bullish MSS sweeps sell-side liquidity before delivering an aggressive upward rupture through a swing high.
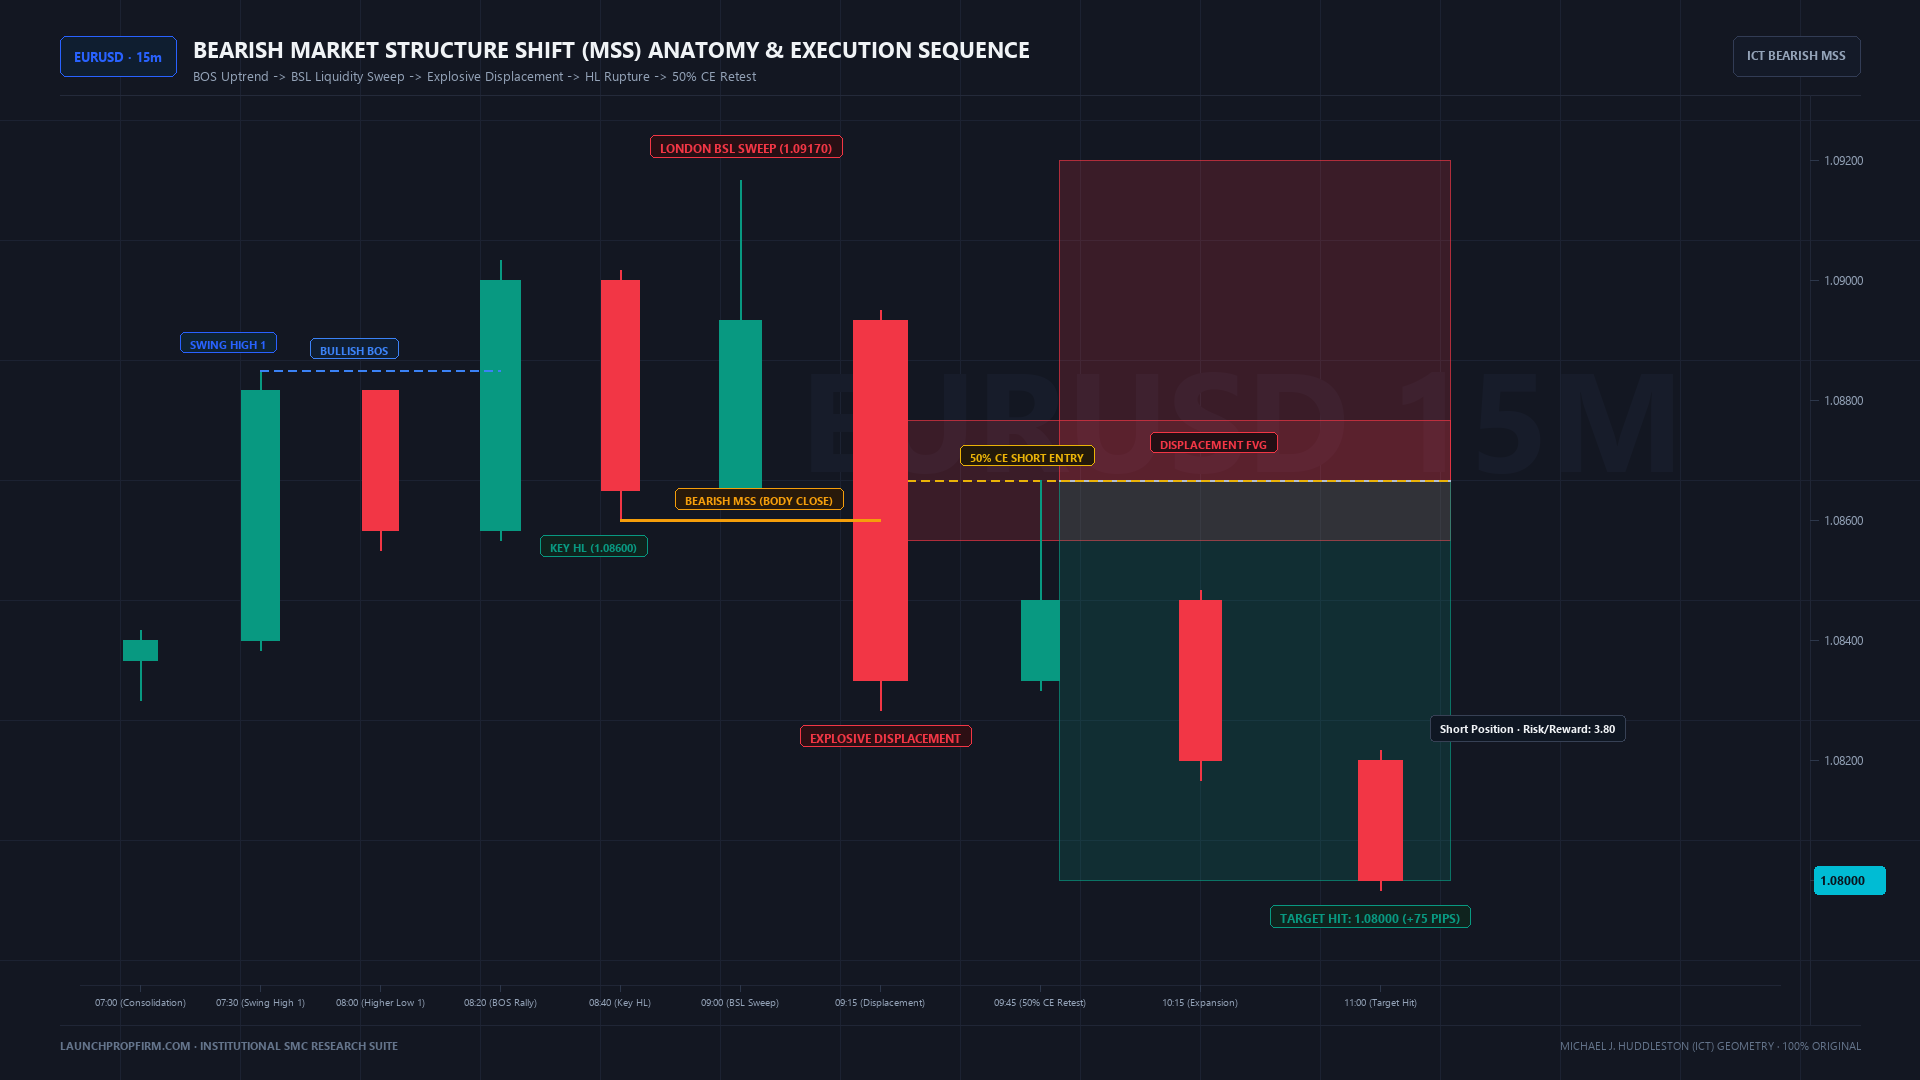
Bearish Market Structure Shift (BSL Sweep to Swing Low Rupture)
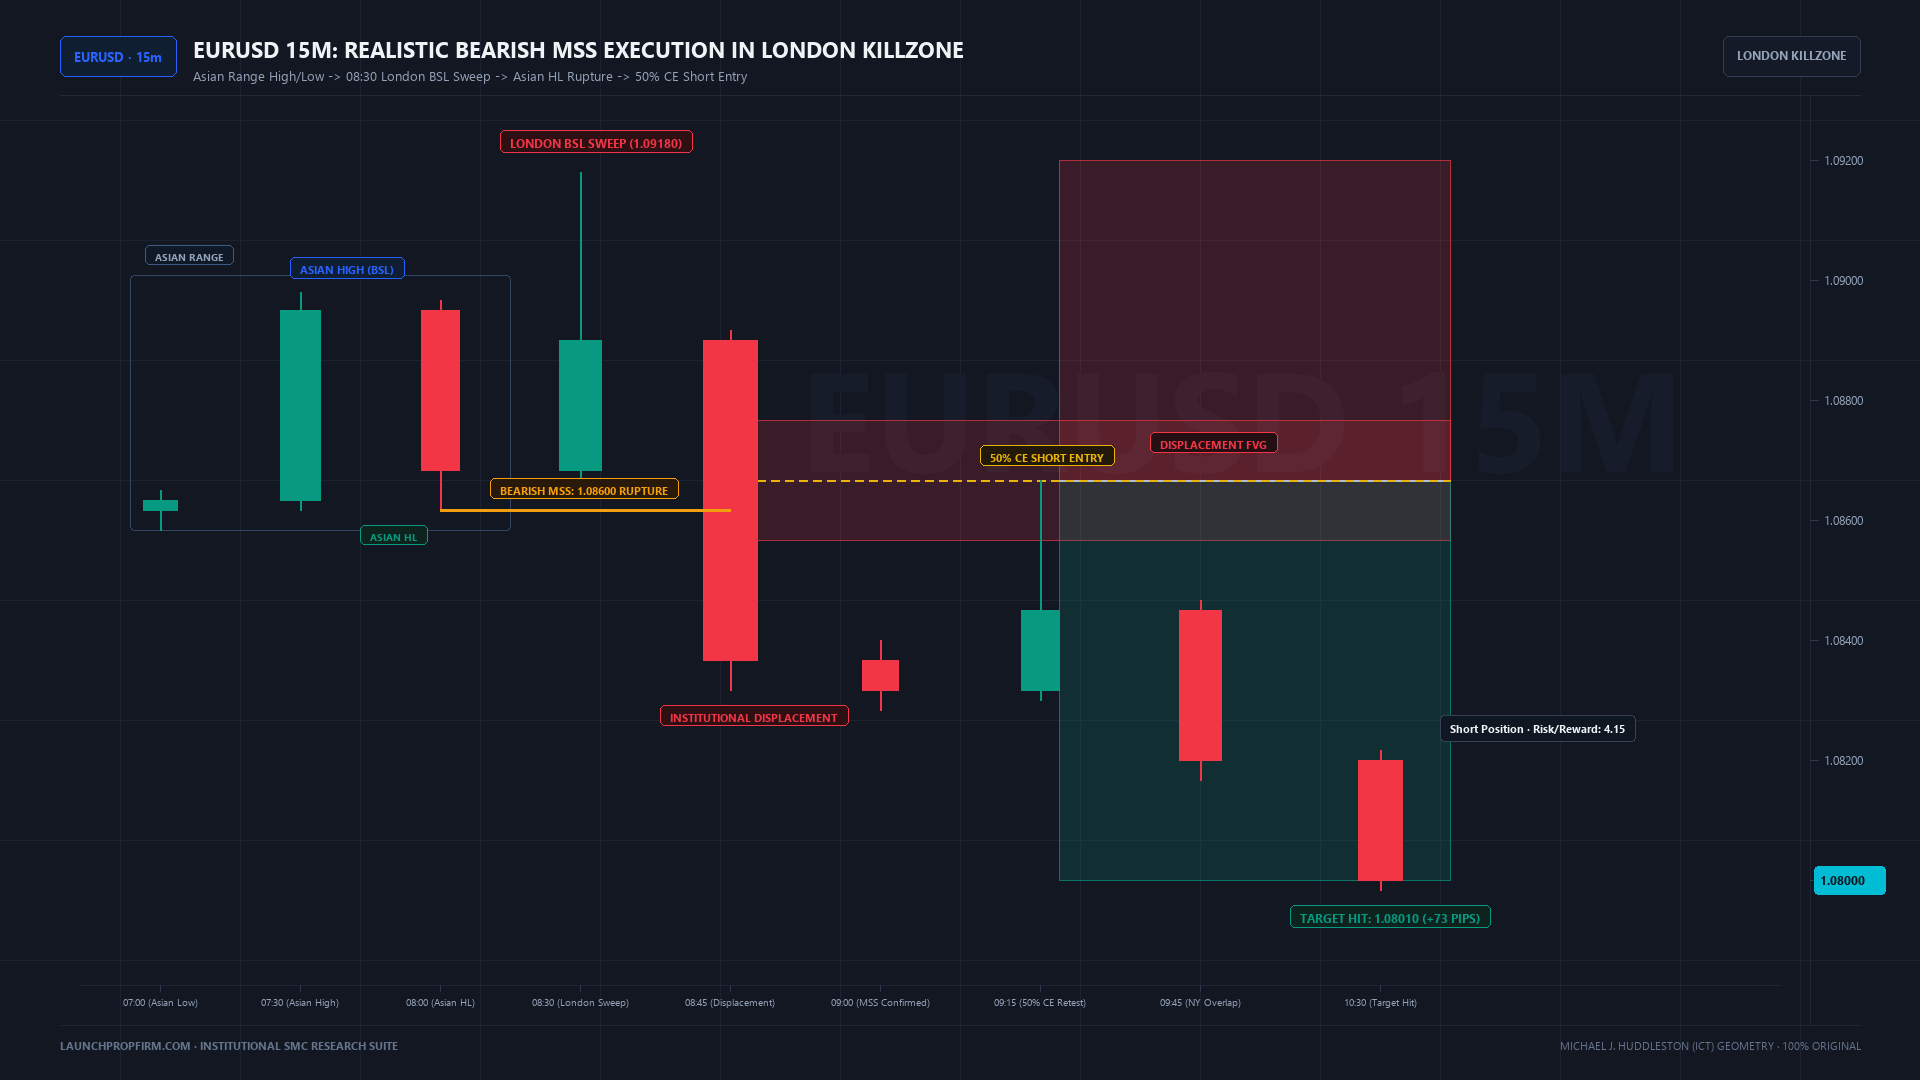
A Bearish MSS sweeps Buy-Side Liquidity (BSL) above a Higher High, displacing downward through the Higher Low. The candle closes below that pivot, offering limit entries at 50% Consequent Encroachment.
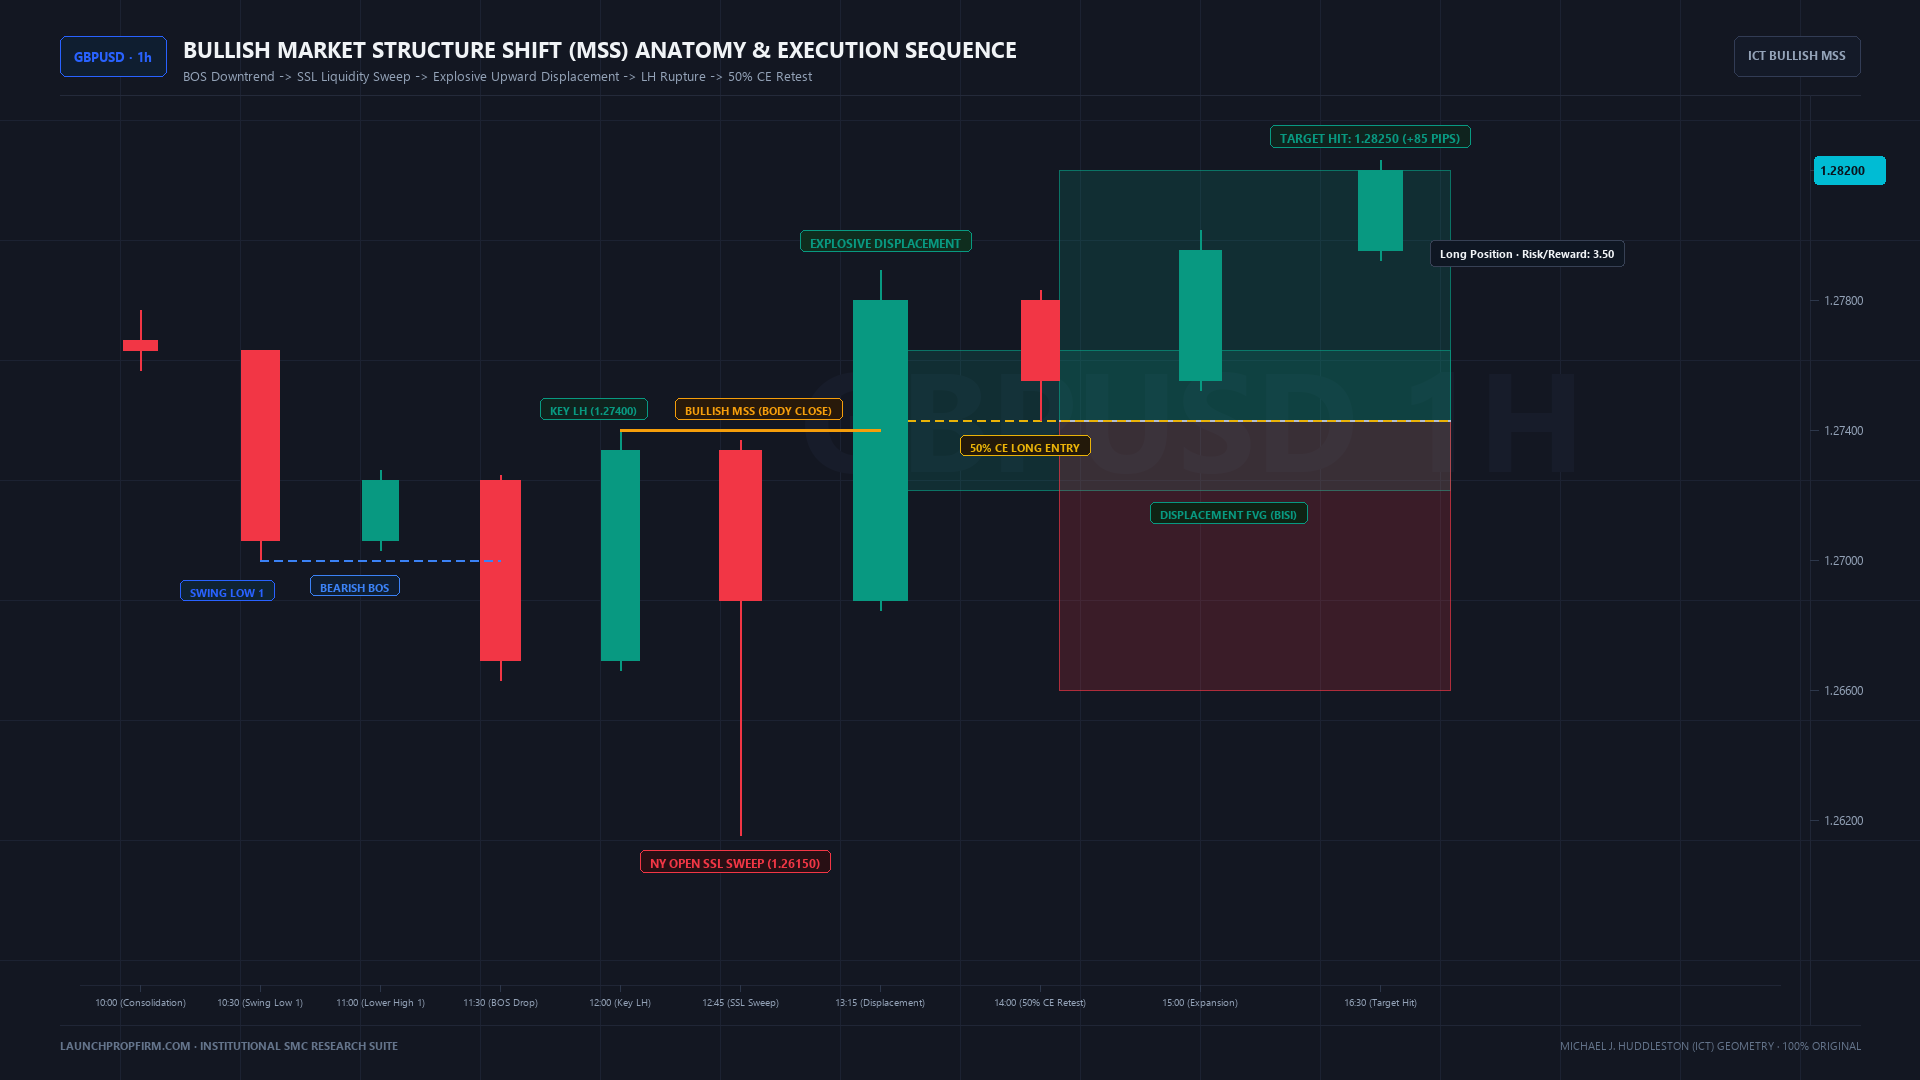
Bullish Market Structure Shift (SSL Sweep to Swing High Rupture)
A Bullish MSS sweeps Sell-Side Liquidity (SSL) below a Lower Low, displacing upward through the Lower High. Once confirmed by body close, traders position long limit orders at the newly formed imbalance.
4. The Golden Confirmation Rule: Wick Piercing vs Candle Body Close
The golden confirmation rule dictates that a Market Structure Shift is validated exclusively by a decisive candle body close beyond the prior swing pivot. A wick that pierces beyond the swing level represents a liquidity sweep, leaving the prevailing trend fully intact rather than reversing structural delivery.
When a candle pierces a pivot with a wick but closes inside range, institutions are absorbing liquidity in a Turtle Soup pattern. Selling wick breaks causes stop-outs when buyers squeeze price into continuation.
Genuine reversal requires institutional commitment, manifesting as a candle body close beyond the pivot. Once confirmed, traders wait for retracements into an inverse fair value gap or breaker block.
5. 4-Step Institutional MSS Execution Framework
The institutional MSS execution framework requires identifying macro liquidity pools, confirming lower timeframe displacement, placing limit orders at 50% Consequent Encroachment of the displacement imbalance, and anchoring defensive stops beyond the sweep extreme. This systematic approach produces high-conviction entries with favorable risk-to-reward metrics.
Step 1: Establish Macro Bias and Liquidity Target
Never trade an MSS without macro context. Analyze 4-hour charts to mark major liquidity pools before session opens.
Step 2: Confirm Lower Timeframe Displacement Rupture
Drop to 15-minute charts after liquidity sweeps. Confirm displacement closes its body past the prior swing pivot.
Step 3: Calibrate 50% CE Limit Orders in Displacement FVG
Identify displacement imbalances using our fair value gap trading strategy rules. Place limit orders at 50% Consequent Encroachment.
Step 4: Position Invalidation Stop Loss and Profit Target
Set defensive stops beyond the sweep wick. Target opposing liquidity for a 1:3.5 minimum return.
6. Institutional Confluence: Breaker Block, FVG, and MSS Alignment
High-probability Market Structure Shift setups occur when structural shifts align with multiple institutional order flow signatures. Confluence between an MSS, a breaker block, and a displacement fair value gap creates an institutional entry corridor where algorithmic delivery accelerates sharply toward opposing liquidity pools.
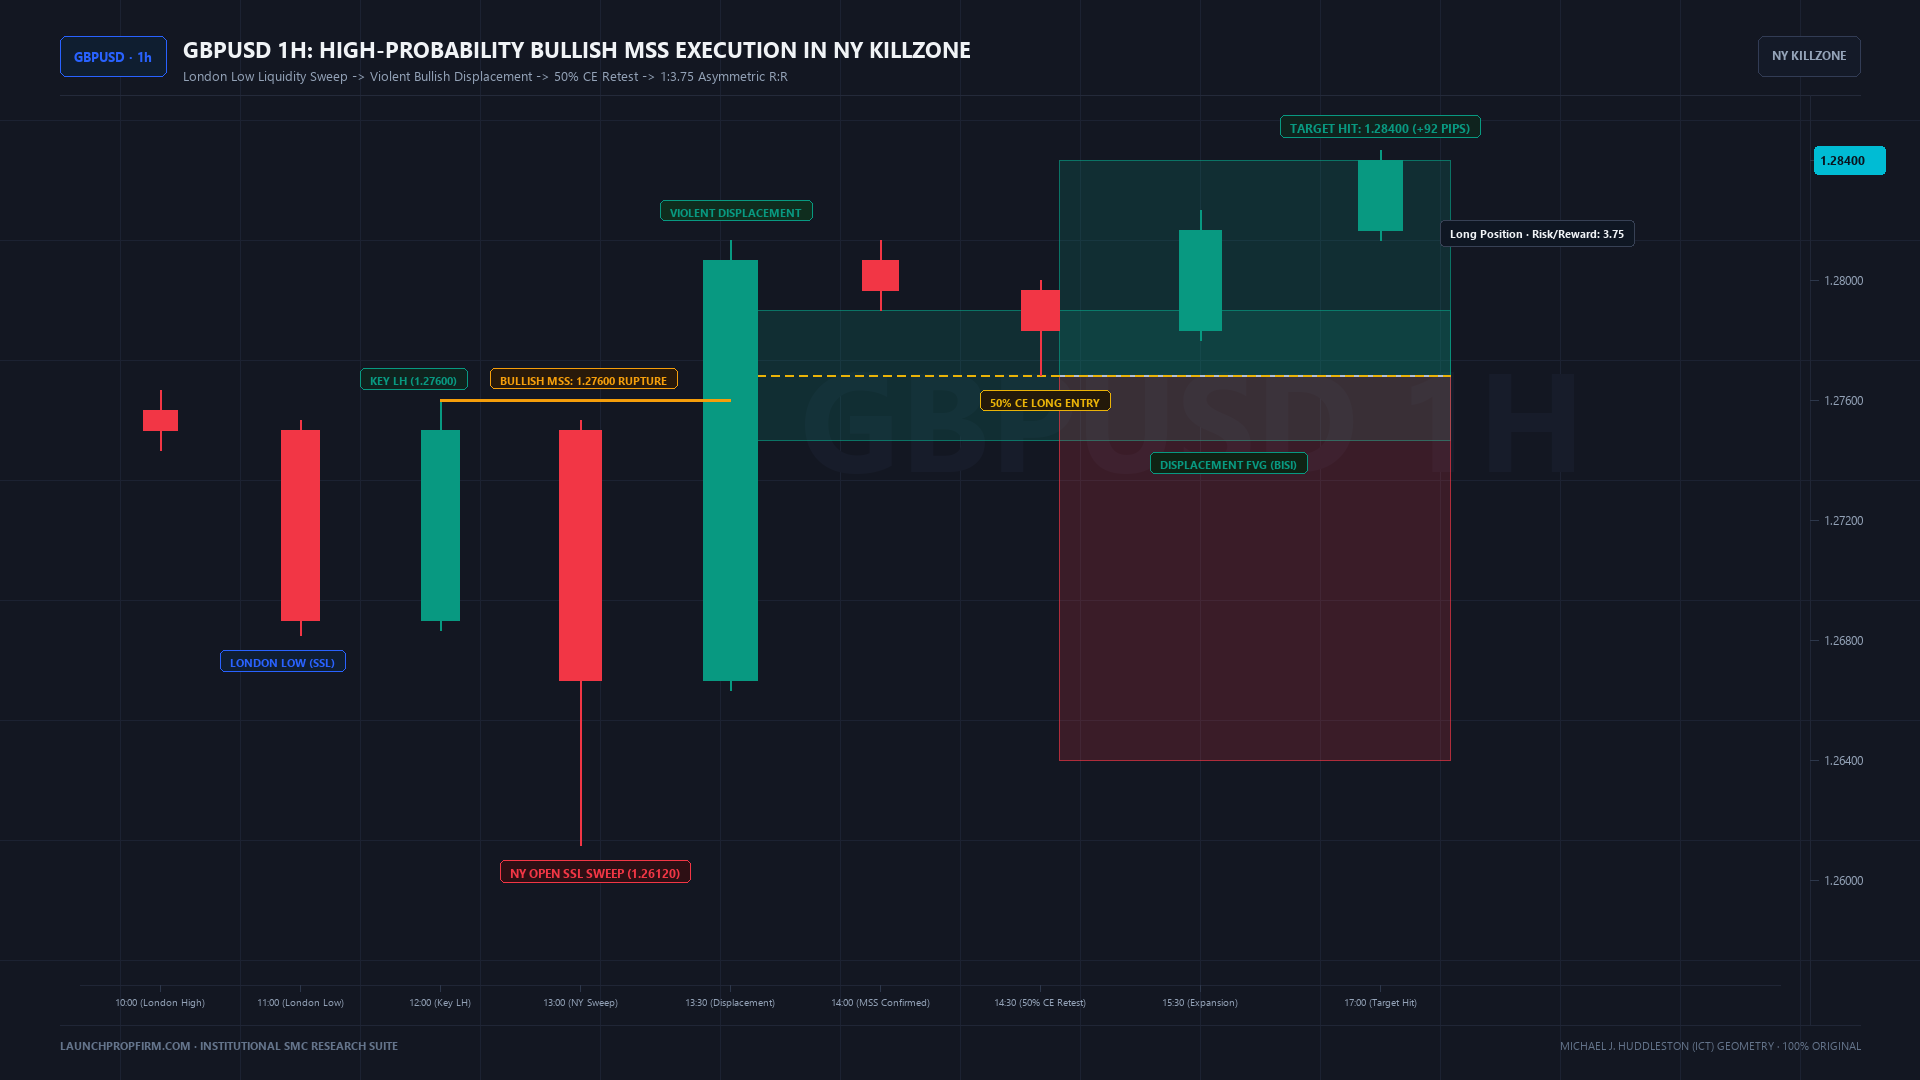
When price sweeps liquidity and reverses, a failed order block transforms into a breaker block trading strategy zone. If displacement leaves an imbalance, the levels overlap into a confluence corridor, triggering rapid expansion.
7. Prop Firm Challenge Risk Management: Lot Sizing & Drawdown Math
Prop firm risk management mandates capping single-trade risk at 0.50% of evaluation equity, sizing positions strictly from technical stop distance, and halting daily trading if cumulative loss reaches 1.5%. These guidelines protect challenge accounts against consecutive drawdowns while preserving capital for high-probability setups.
| Evaluation Tier | Daily Limit (5%) | Max Trade Risk (0.50%) | Invalidation Buffer | Max Lot Size |
|---|---|---|---|---|
| Tier 10k | $500.00 | $50.00 | 20 Pips | 0.25 Lots |
| Tier 50k | $2,500.00 | $250.00 | 20 Pips | 1.25 Lots |
| Tier 100k | $5,000.00 | $500.00 | 20 Pips | 2.50 Lots |
Calculate position sizing with our profit loss calculator. Track metrics on our prop firm drawdown calculator, audit consistency with our prop firm consistency calculator, and simulate passing math on our prop firm pass probability calculator. Review our guide on prop firm daily drawdown reset times to protect rollover buffers.
8. 3 False MSS Traps That Blow Funded Accounts
The three most dangerous Market Structure Shift execution traps include confusing minor internal structure breaks with macro shifts, taking counter-trend reversals directly into higher timeframe discount zones, and entering on volatile macroeconomic news wicks. Avoiding these execution errors preserves evaluation capital and protects trader longevity.
Trap 1: Internal Sub-Structure Breaks Confused for Major Shifts
Traders often mistake minor 1-minute fluctuations for major shifts. In low ranges, price oscillates without commercial intent. Always anchor pivots to clear 15-minute or 1-hour swings.
Trap 2: Counter-Trend Shift in Higher Timeframe Discount Territory
Executing a Bearish MSS when macro structure sits in discount territory invites failure. Macro buyers overwhelm lower timeframe shifts. Pair analysis with our guide on bullish reversal patterns to avoid shorting accumulation floors.
Trap 3: Low-Displacement Macroeconomic News Spikes
Entering limit orders during news prints exposes accounts to slippage. News spikes frequently print erratic wicks through key levels. Wait fifteen minutes after releases for order flow to stabilize before trading.
9. Quantitative MSS Trading Journal Protocol
A quantitative MSS trading journal methodically records session timing, liquidity sweep depth, displacement velocity, and realized risk-to-reward ratios across a twenty-trade sample. Logging these execution variables confirms statistical edge viability before allocating live evaluation capital on prop firm challenge accounts.
Structured journaling builds mechanical habits and eliminates emotional bias. Track executions with our free trade journal spreadsheet, and explore execution psychology in our guide on the advantages of forex trading.
10. Frequently Asked Questions (FAQ)
What is the primary difference between an MSS and a BOS?
A Break of Structure (BOS) represents trend continuation by breaking a swing high in an uptrend or swing low in a downtrend. An MSS represents authentic trend reversal by breaking opposing swing structure following a liquidity sweep.
How do you confirm a Market Structure Shift is valid?
An MSS is confirmed exclusively when an aggressive displacement candle closes its body beyond the prior swing pivot. A wick that pierces without a body close represents a liquidity sweep, leaving the original trend active.
Which timeframes work best for trading Market Structure Shifts?
Combining 1-hour or 4-hour higher timeframes with 15-minute or 5-minute lower timeframe execution delivers the highest win rate. Higher timeframes establish bias, while lower timeframes provide entry timing.
Where should you position your stop loss on an MSS trade?
Place your defensive stop loss two to three pips beyond the extreme swing wick that swept liquidity before displacement. Never place stops inside the displacement gap or on broken pivots.
What is the relationship between an MSS and a Fair Value Gap?
A valid Market Structure Shift requires aggressive displacement, creating a three-candle Fair Value Gap. Traders use this imbalance as their entry zone, placing limit orders at the 50% Consequent Encroachment midpoint.
Prop firm founders and mentors can leverage our enterprise prop technology to deploy custom evaluation challenges with automated risk monitoring. Review economics on our compare page, read insights on our trading blog, or test parameters with our free trader tools. For operators seeking an independent brand, review our scalable white label prop firm software architecture.
Evaluate Your Prop Firm Readiness Score (0-100)
Answer 5 quick operational questions about your acquisition channels, runway, and engine tech to get a personalized launch roadmap.

M.Haris
Founder & Platform ArchitectBuilding open prop trading software infrastructure for operators worldwide
I built LaunchPropFirm to give forex educators, trading communities, and fintech operators complete ownership of their platform with full source code and zero monthly SaaS rent. Every article on this blog is drawn from hands-on platform development, live MT5 risk bridge mechanics, and real operator economics.
All content, financial models, ROI estimates, and architecture guides on LaunchPropFirm are published strictly for educational and informational purposes. LaunchPropFirm provides institutional prop trading software and technology infrastructure; it does not operate as a broker, custodian, or registered investment advisor.
Evaluation challenges and funded trader accounts referenced in this guide operate in simulated demo trading environments using real-time market data feeds. Simulated trading results do not represent actual trading performance or financial advice.
Recommended Next Reads
Hand-picked operator guides to scale your prop trading platform.
Inverse Fair Value Gap: Complete IFVG Trading Strategy
Master the inverse fair value gap (IFVG) trading strategy. Learn polarity flips, the candle body close rule, 50% CE entries, and the ICT unicorn model.
Fair Value Gap Trading Strategy: Complete FVG Guide
Master the fair value gap trading strategy. Learn how to identify BISI, SIBI, and consequent encroachment with exact entry, stop loss, and RR rules.
Community Monetization & Platform Ownership
Run a Trading Discord, Telegram, or Signal Group? Launch Your Own Prop Firm in 7 Days.
Stop sending your community to third-party prop firms. Own our complete white-label prop firm platform with all automated risk engines, live TradingView charts, MT5 bridge, and paid tournament engine from just $995 down under 50% milestone escrow. Zero monthly SaaS fees.