Free Trade Journal: Excel Spreadsheet Template & Guide
Download our free trade journal Excel template for prop firm traders. Track R-multiples, win rate, daily drawdown, and emotional discipline in 2026.
Why do 95% of retail traders fail their prop firm evaluation challenges within the first two weeks?
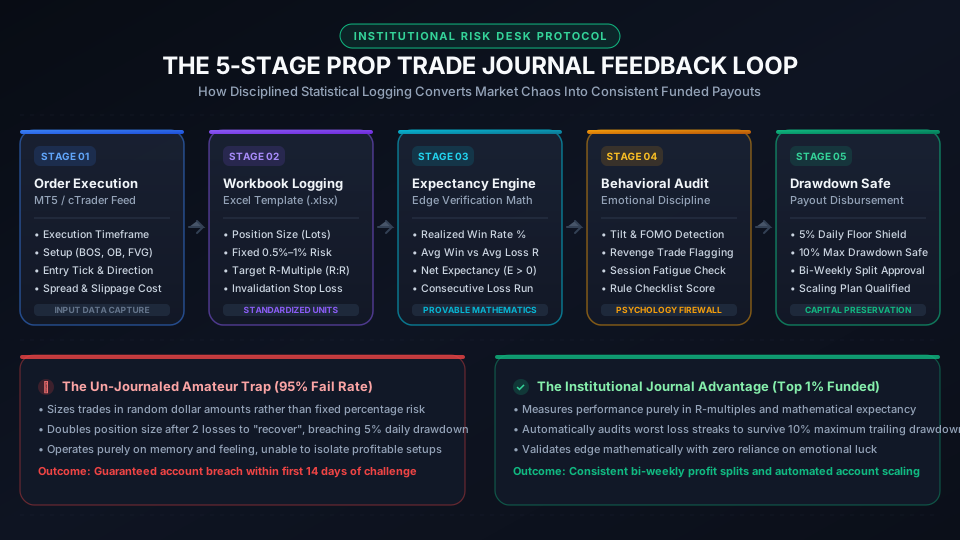
The failure is almost never a lack of technical chart knowledge. In modern trading, anyone can learn to spot a Break of Structure (BOS) or an Order Block on YouTube in an afternoon.
The catastrophic breakdown happens because 95% of retail traders operate completely blind without a trade journal.
They trade based on raw emotion, size positions inconsistently in arbitrary dollar amounts, double their risk during losing streaks, and rely entirely on memory to evaluate their edge. When market volatility shifts, their equity curve collapses, triggering an automatic breach of the prop firm's 5% daily drawdown rule.
Professional institutional proprietary traders do not rely on memory. They treat trading as a high-precision probability business. Every single order is logged, measured in standardized units of risk (R-Multiples), and analyzed to calculate real mathematical expectancy.
To help retail prop traders establish institutional discipline, LaunchPropFirm has built and released the [Professional Trading Journal Workbook (.xlsx)](/downloads/Professional_Trading_Journal_Workbook.xlsx) — a 100% free, multi-sheet Excel spreadsheet template engineered specifically for prop firm evaluation rules, daily drawdown tracking, and behavioral auditing.
1. Why Un-Journaled Traders Fail Prop Firm Challenges
In personal margin trading, an undisciplined trader who takes an emotional loss can deposit more money to stay alive (as explored in our breakdown of how much money you need to start day trading).
In proprietary firm evaluations (such as Forex, CFD, and crypto challenges), you are constrained by hard automated risk circuit breakers:
- The Maximum 5% Daily Drawdown Limit: Measured either from midnight balance or equity high-water mark.
- The Maximum 8% to 10% Overall Drawdown Limit: The hard floor that terminates your account.
- The Consistency Rule: Requiring that no single trading day accounts for more than 33% to 50% of your total evaluation profit.
The Illusion of Memory
When you do not log trades immediately in a structured journal, your brain distorts historical reality. Psychological studies prove that human memory suffers from severe cognitive bias:
- Confirmation Bias: You vividly remember your single +5R home-run trade on Gold, while subconsciously forgetting the four -1R sloppy losses that preceded it.
- The Outcome Fallacy: You evaluate a trade as "good" simply because it made money, even if you took 5x standard lot size and removed your stop loss.
- Session Amnesia: You fail to realize that 80% of your net profits occur during the London-New York overlap, while your Asian session trades consistently bleed capital.
Without an objective trade log, you cannot separate genuine strategic edge from temporary market luck.
2. Amateur vs Institutional Prop Firm Trade Logging
Most amateur traders who attempt to journal make one of two fatal mistakes: they either write useless diary entries (*"Felt good about EUR/USD today"*) or they buy overly complex SaaS journaling subscriptions that charge $30 to $50 per month just to display basic charts.
Institutional prop traders use a lean, formula-driven spreadsheet that captures only actionable quantitative and psychological data:
| Metric Tracked | Amateur Trade Log | Institutional Prop Firm Journal (.xlsx) |
|---|---|---|
| Performance Unit | Nominal Dollars (e.g. "+$320" or "-$180") | Standardized R-Multiples (e.g. "+2.5R" or "-1.0R") |
| Risk Measurement | Random lot sizes based on account balance | Fixed 0.50% to 1.00% account risk per trade idea |
| Setup Model | Vague gut feeling ("Looked like it was going up") | Tagged Strategy (Bullish BOS, Bearish OB, Liquidity Sweep) |
| Session & Timing | Untracked (trades at random hours) | Execution Session (London Open, NY Open, Asian Session) |
| Psychological State | Ignored completely | Pre-Trade Mindset (Disciplined, FOMO, Revenge, Fatigued) |
| Drawdown Monitoring | Checked manually on MT5 terminal after losses | Automated daily equity buffer calculation against 5% breach floor |
| Mathematical Output | Simple win rate percentage (meaningless alone) | Net Mathematical Expectancy (E) and Max Drawdown Streak |
3. Inside the Free Trade Journal Excel Template
The [Professional Trading Journal Workbook (.xlsx)](/downloads/Professional_Trading_Journal_Workbook.xlsx) was engineered by our institutional risk desk to give retail traders the exact analytical tools used by proprietary desk managers.
The 5 Worksheets Included:
#### Sheet 1: Trade_Log (The Daily Execution Engine)
This is your primary execution ledger. For every trade taken on MetaTrader 5, cTrader, DXtrade, or TradingView, you log:
- Trade ID & Date/Time: Auto-stamps the chronological sequence.
- Asset / Pair: Dropdown supporting EUR/USD, GBP/USD, USD/JPY, Gold (XAU/USD), US30, NAS100, and BTC/USD.
- Direction & Setup: Long vs Short, tagged by technical setup (BOS, Order Block, Liquidity Sweep, Fair Value Gap).
- Execution Prices: Planned Entry, Invalidation Stop Loss, and Take Profit.
- Position Sizing: Automated calculation verifying that your lot size represents strictly 0.50% to 1.0% of nominal challenge capital (use our free Prop Firm Lot Size Calculator prior to entering tickets).
- Outcome & R-Multiple: Automatically calculates realized P&L ($) and realized R return (+2.0R, -1.0R, 0.0R break-even).
- Rule Adherence Check: A binary 1/0 toggle confirming whether you followed your pre-trade trading plan.
#### Sheet 2: Monthly_Performance (Executive KPI Dashboard)
Automatically aggregates your daily execution data into executive performance metrics:
- Total Trades Executed, Win Rate %, and Loss Rate %.
- Average Winning Trade (R) vs Average Losing Trade (R).
- Largest Winning Day vs Largest Losing Day.
- Maximum Consecutive Loss Streak (vital for surviving 10% maximum drawdown limits).
#### Sheet 3: Equity_Curve (Visual Trajectory)
An automated dynamic line chart that plots your cumulative equity trajectory against your prop firm's Profit Target (Phase 1: 8%, Phase 2: 5%) and Maximum Drawdown Floor (10%).
#### Sheet 4: Setup_Analysis (Edge Isolation Matrix)
Breaks down your win rate and net R-multiples by setup type and trading session. If your journal reveals that your *New York BOS setups* produce +18.4R with a 62% win rate, while your *Asian session scalp setups* produce -8.2R with a 28% win rate, the mathematical remedy is obvious: immediately stop trading Asian sessions.
#### Sheet 5: Rule_Checklist (The Daily Pre-Flight Protocol)
A disciplined 8-point checklist that every trader must review before placing their first trade of the session (News filter, Daily Drawdown buffer check, Spread verification, and Emotional State audit).
Skip the monthly fees
Own your prop firm platform outright. One time purchase.
Full source code. Live in 7 days. No revenue share. No monthly SaaS bill. See the exact platform before paying anything.
Demo login: haris / asdf1122. No signup needed
4. The Mathematical Expectancy Engine Behind Payouts
Why is tracking R-Multiples and Expectancy far more important than tracking your nominal dollar win rate?
Because in day trading, win rate by itself tells you virtually nothing about long-term survival (as explained in our analysis of why day trading is hard). A trader with an 85% win rate can blow their entire funded challenge on a single runaway loss, while a trader with a 38% win rate can consistently withdraw bi-weekly payouts.
Mathematical expectancy is calculated using the standard institutional formula embedded directly inside our Excel journal:
The Mathematical Expectancy Formula:
Expectancy (E) = (Win Rate × Average Win) − (Loss Rate × Average Loss)
Where:
Mathematical Proof:
E = (0.42 × 2.4R) − (0.58 × 1.0R) = +1.008R − 0.580R = +0.428R per trade
Over a sample of 50 trades, this trader generates +21.4R in net profit. On a $100,000 challenge account risking $500 (0.50%) per trade, that +21.4R translates to +$10,700 in net gains, comfortably passing both Phase 1 (8%) and Phase 2 (5%) evaluations despite losing more than half of all trades.
5. The Operator Perspective: How Prop Firms Audit Trade Logs
Why do proprietary trading firms pay so much attention to trader execution history and consistency?
When retail traders submit payout requests on funded accounts (or celebrate after receiving their certificate, as covered in our first 48 hours as a funded trader guide), the prop firm's risk desk does not merely check if your balance is positive.
They execute an automated compliance audit on your account's trade history ledger.
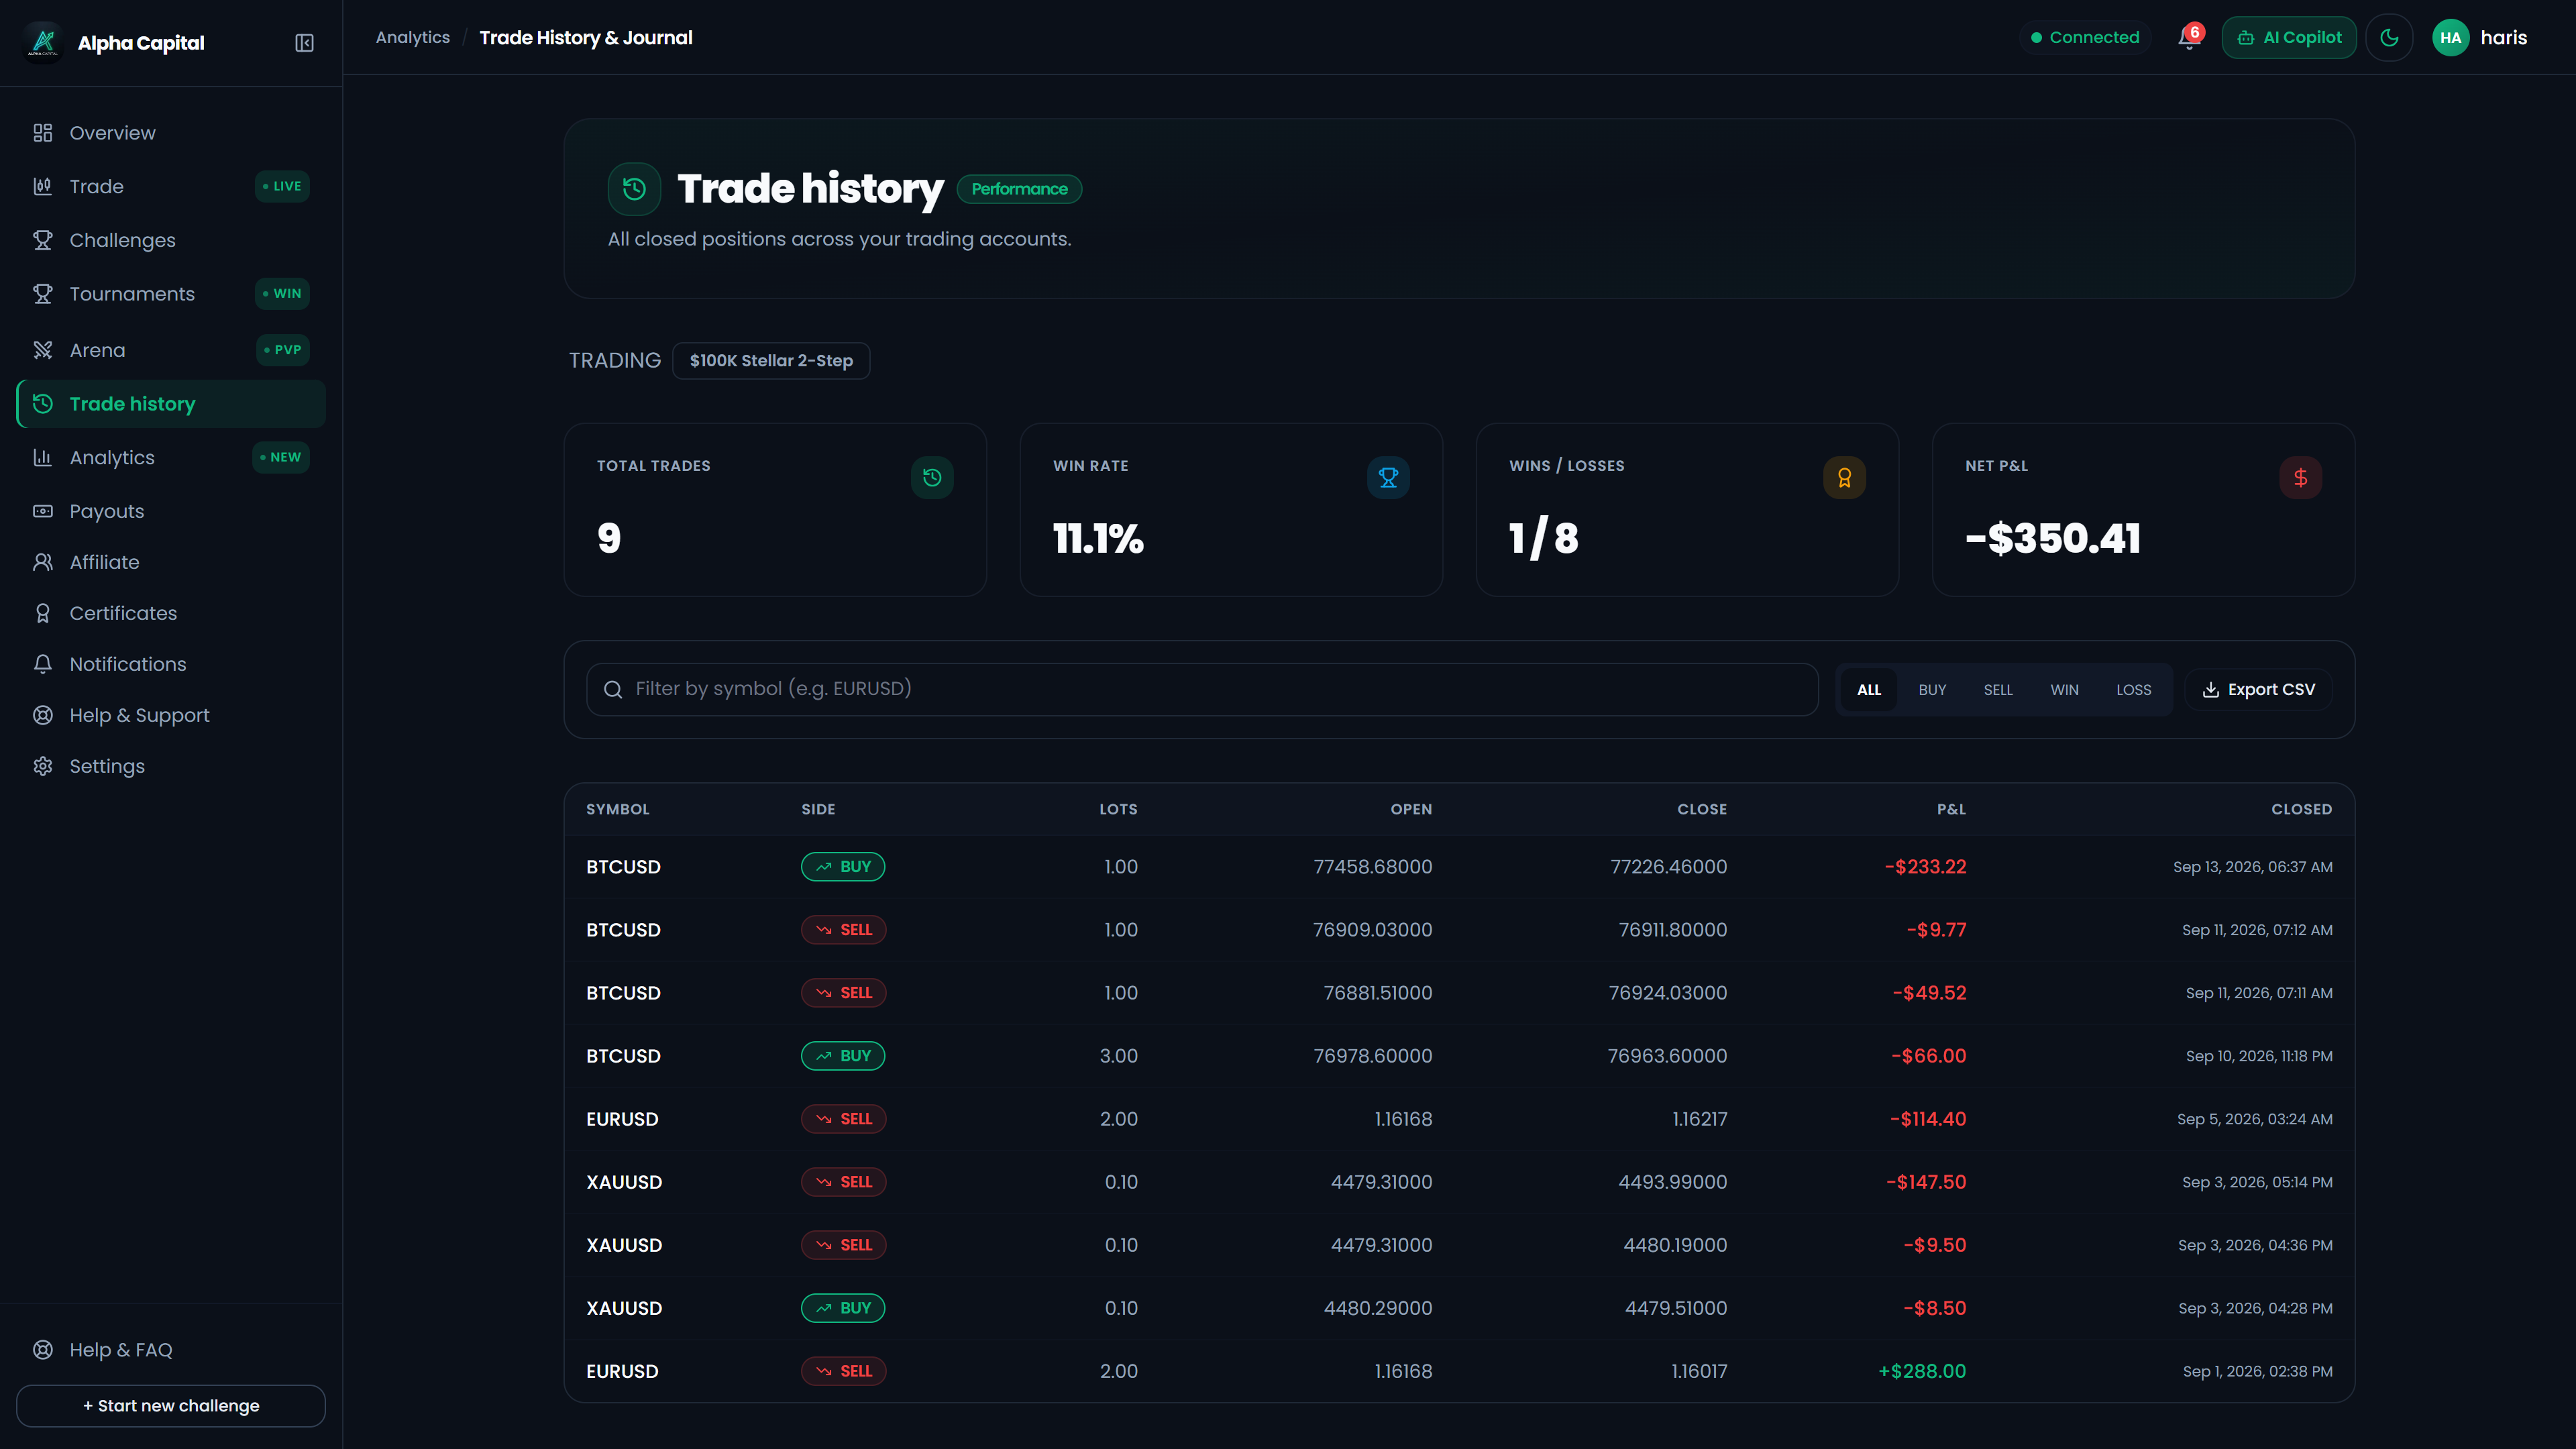
What the Prop Firm Risk Desk Audits:
- Lot Size Variance: Did you risk 0.5 lots on 18 consecutive trades, and then suddenly enter 15 lots on Gold during US CPI news? Extreme lot size deviation is flagged as gambling and breaches consistency rules.
- Trade Duration (HFT / Latency Detection): Were trades held for less than 30 to 60 seconds to exploit price feed discrepancies between bridges?
- Syndicated Account Copying: Are your exact entry ticks and stop levels identical to dozens of other challenge accounts? Prop firms use automated syndicate radar to ban third-party bot passing services.
- Consistency Cap: Did your single best trading day generate more than 40% to 50% of your total withdrawal request? Verify your compliance using our free Prop Firm Consistency Calculator.
Prop firm operators deploying LaunchPropFirm's turnkey, self-hosted white label software ($2,495 one-time purchase with full Next.js/Node.js source code ownership and zero monthly SaaS fees) access this telemetry directly inside their Admin Analytics Hub.
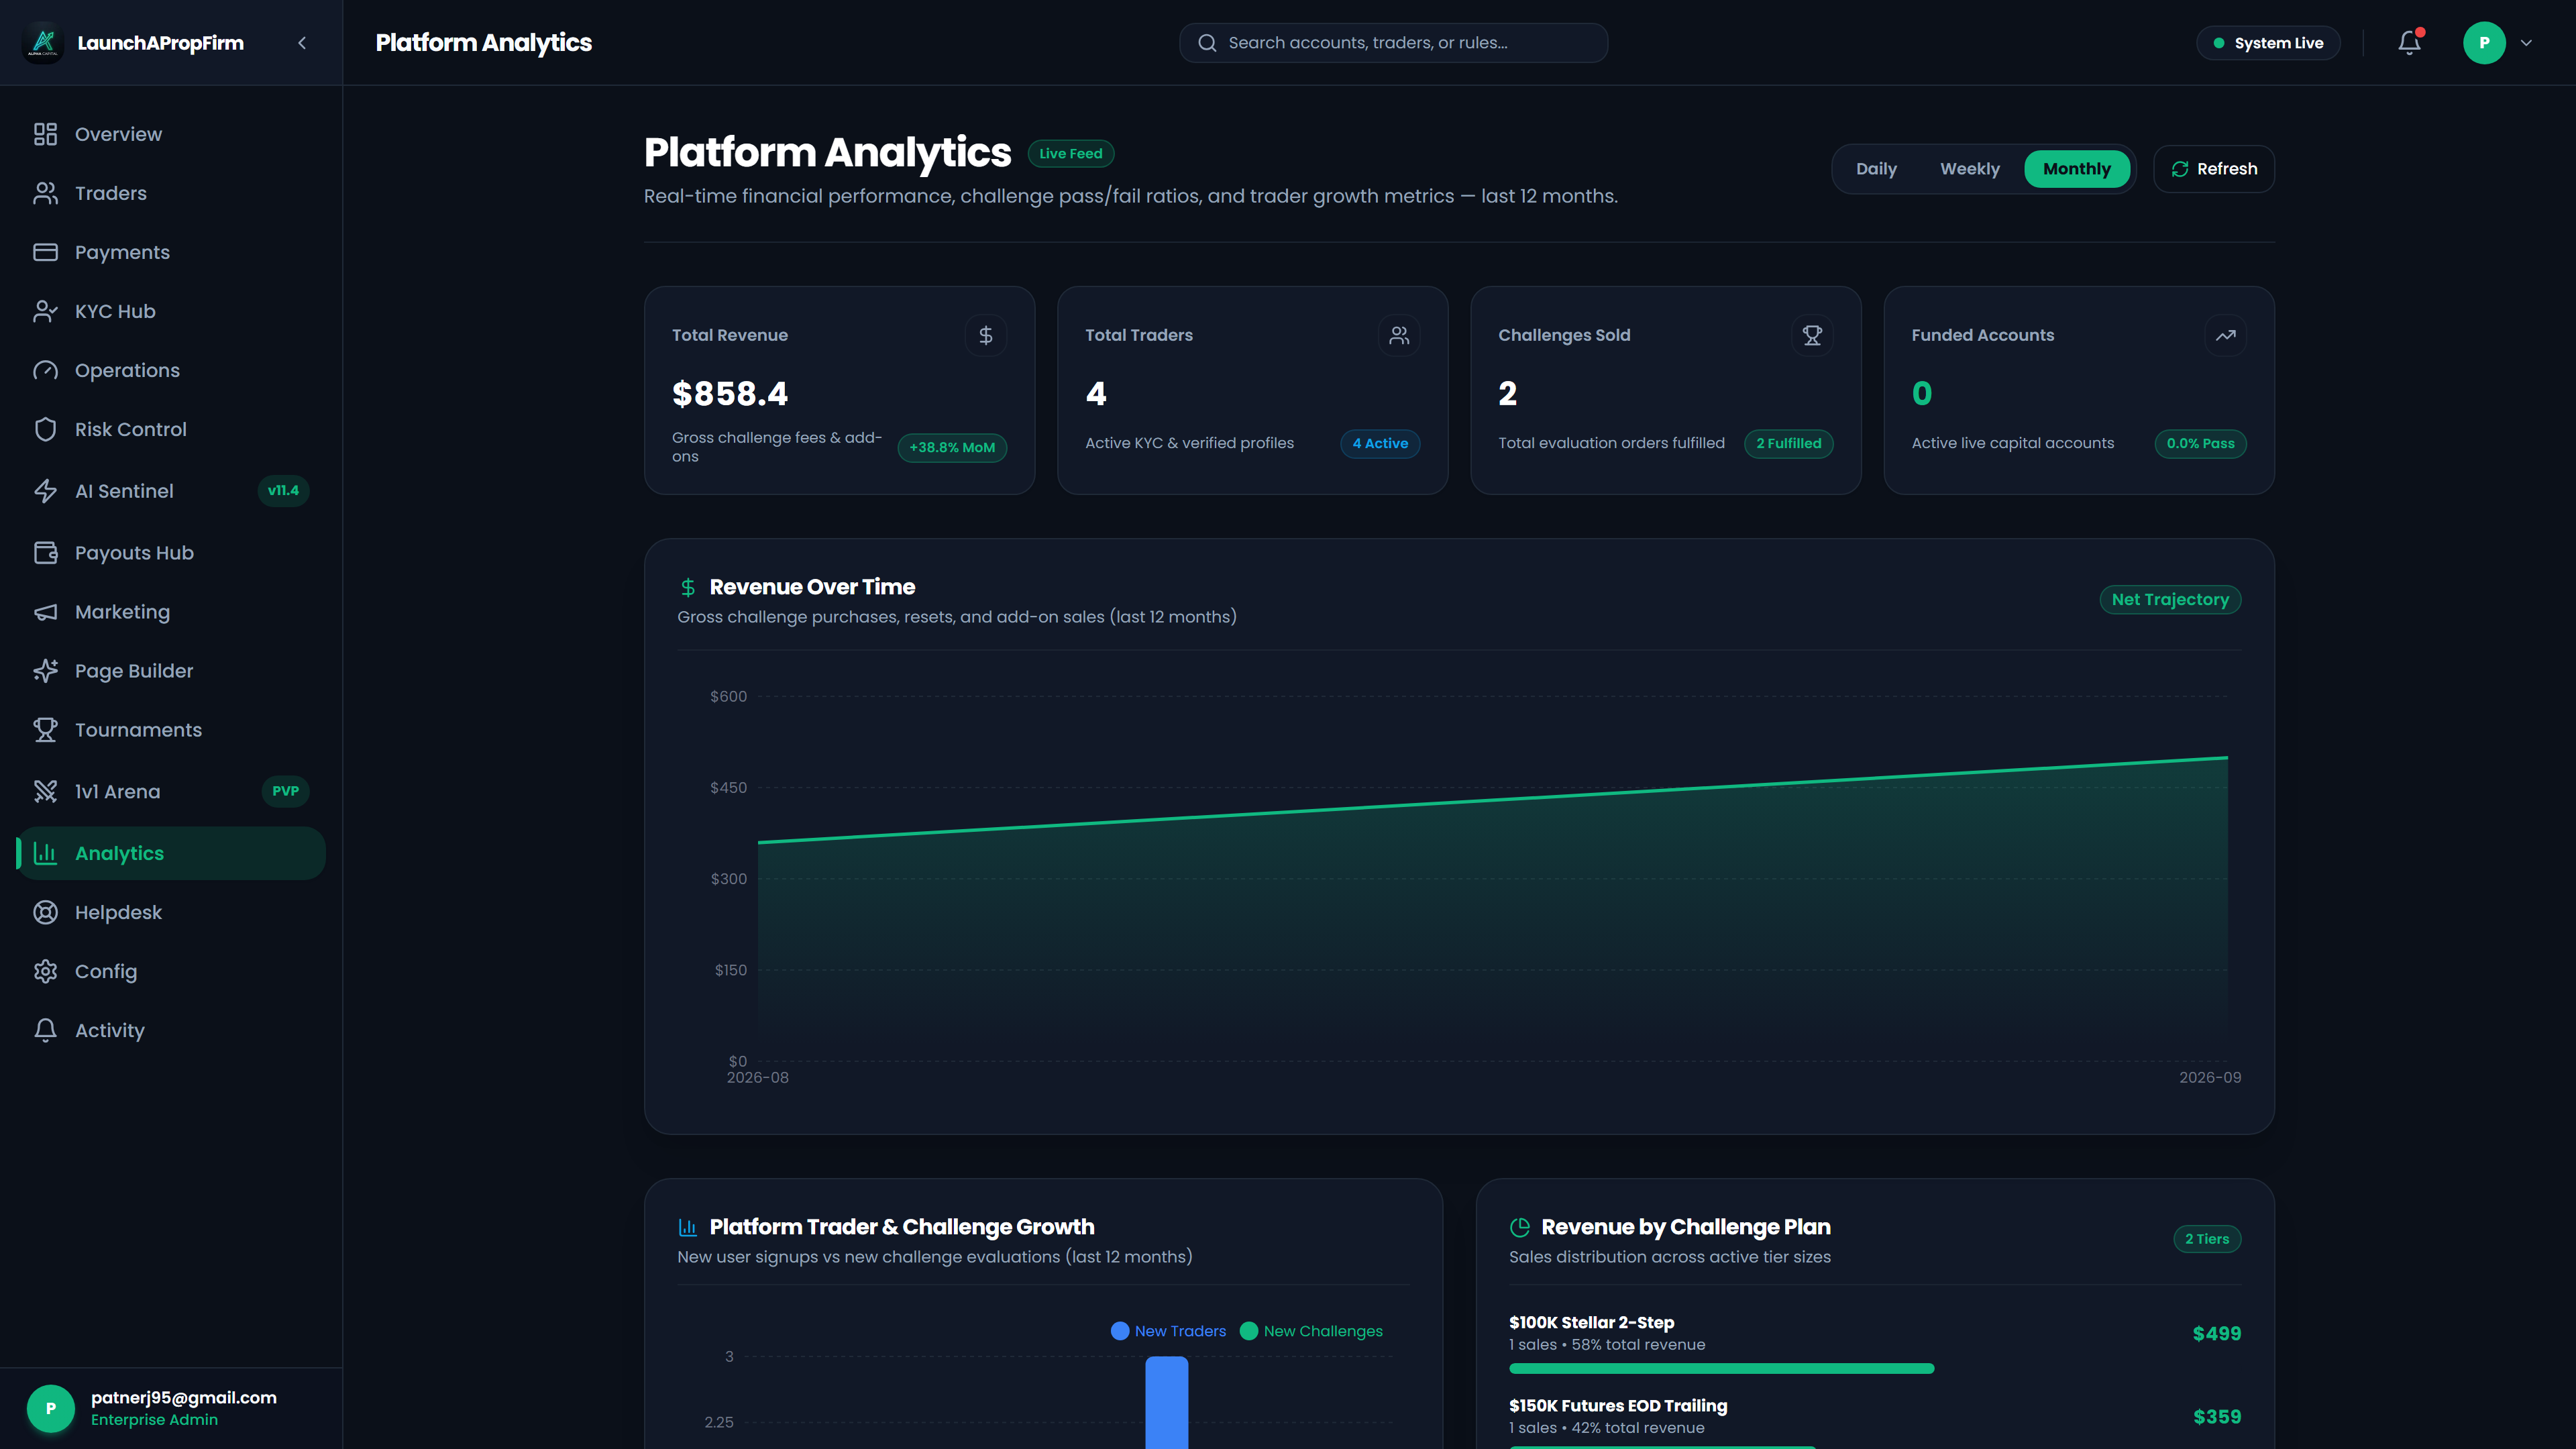
Our automated AI Sentinel monitors trade distribution across MetaTrader 5, cTrader, and browser-native TradingView terminals, distinguishing disciplined price-action swing traders from toxic latency exploiters in real time.
6. Daily Routine: How to Use the Free Trade Journal
To get the full psychological and statistical benefit of trade journaling, follow this 4-step daily operational routine:
Step 1: Pre-Market Preparation (10 Minutes Before Session)
- Open the Rule_Checklist tab in your Excel journal.
- Check the economic calendar for high-impact Red Folder news events (FOMC, CPI, NFP). Never enter new market orders within 5 minutes before or after high-impact releases.
- Confirm your Daily Drawdown Cushion. If your starting equity is $100,000, your hard daily floor is $95,000. If you are already down $1,500 on the day, your remaining operational buffer is strictly $3,500.
Step 2: Pre-Trade Parameter Verification (1 Minute Before Entry)
- Calculate your position size before opening the ticket. Use our Prop Firm Lot Size & Pip Risk Calculator so that your stop loss represents strictly 0.50% to 1.0% of your nominal account balance.
- Log your Planned Entry, Stop Loss, Target Take Profit, and Setup Model into the Trade_Log worksheet.
- Paste a link to your TradingView chart markup in the *Chart_URL* column.
Step 3: Post-Trade Execution Logging (Immediately After Exit)
- Once the trade is closed by stop loss or take profit, record the Exit Price and Exit Reason.
- Note your emotional state during the trade: Did you feel anxious? Did you move your stop loss to break-even too early? Did you experience FOMO?
- The sheet will immediately compute your realized R-Multiple and update your cumulative equity curve.
Step 4: Weekend Performance Audit (30 Minutes on Saturday)
- Open the Setup_Analysis tab.
- Review your cumulative win rate and R-multiples across each strategy tag.
- Eliminate your lowest-performing setup and focus 100% of your capital on your highest-expectancy model for the upcoming trading week, following the exact routine used by the most successful day traders.
Real-World Worked Example: Logging a Winning Gold (XAU/USD) BOS Setup vs a Losing FOMO Trade
To see how our Excel workbook transforms raw trade tickets into actionable institutional feedback, compare how two different trades on a $100,000 evaluation account are recorded inside the Trade_Log sheet:
| Journal Field | Trade #14: Disciplined Institutional Execution | Trade #15: Impulsive FOMO Execution |
|---|---|---|
| Instrument & Session | XAU/USD (Gold) / London-NY Overlap | EUR/USD / Late New York Close |
| Setup Classification | Bullish Break of Structure (BOS) + Order Block | Impulsive Breakout Chase (No Setup) |
| Account Balance & Risk % | $100,000 Balance / 0.50% Risk ($500) | $101,500 Balance / 2.00% Risk ($2,030) |
| Entry, Stop Loss & Target | Entry: $2,640.00 / SL: $2,635.00 / TP: $2,655.00 | Entry: 1.1145 / SL: 1.1125 / TP: 1.1165 |
| Calculated Position Size | 1.00 Standard Lot ($5.00 move = $500 risk) | 10.15 Standard Lots (20 pips = $2,030 risk) |
| Realized Outcome & R-Multiple | Closed at TP: +$1,500 (+3.00R) | Stopped Out in 4 Minutes: -$2,030 (-1.00R, 4x oversized) |
| Post-Trade Audit Note | Waited for 15m candle body close above swing high before setting limit order. | Entered market order after missing initial move; violated 0.50% risk cap and erased prior 3R win. |
When you review these two rows side by side on Saturday morning, the conclusion is unmistakable: your technical edge works when you follow your rules, and your entire equity drawdown comes from unscheduled, oversized FOMO entries.
5-Point Self-Audit: Is Your Current Trade Routine Institutional Grade?
Before you open your trading terminal for the next market session, score yourself honestly against these five operational benchmarks:
- Pre-Trade Risk Calculation: Do you calculate your exact lot size before every single order so that a stop-loss hit never costs more than 0.50% to 1.0% of your account balance?
- Standardized R-Multiple Tracking: Can you state your exact average realized R-Multiple over your last 30 trades without guessing?
- Session & Setup Filtering: Do you know mathematically whether you make more money during the London open or the New York overlap?
- Daily Drawdown Buffer Awareness: Do you write down your exact hard daily equity floor before placing your first trade of the morning?
- Emotional Tilt Circuit Breaker: Do you have a strict, written rule that forces you to close your charting platform after two consecutive 1R losses in a single day?
Want a Free Desk Review of Your Last 20 Logged Trades? If you scored less than 4 out of 5 on this audit, download the workbook below, log your last 20 trades from your MT5, cTrader, or TradingView history, and message our risk engineering desk on WhatsApp (+92 315 8583905) for a candid breakdown of your expectancy leaks.
7. Download Your Free Professional Trading Journal
Stop trading based on vague memory, emotional impulses, and undisciplined position sizing.
Take full institutional control of your prop firm evaluation challenges today with our battle-tested, formula-driven Excel trading journal:
Free Lead Magnet Download:
Download the complete, unlocked spreadsheet workbook with automated formulas, dynamic equity curve charts, and pre-trade risk checklists:
📥 [Download Professional Trading Journal Workbook (.xlsx)](/downloads/Professional_Trading_Journal_Workbook.xlsx)
*(No email signup required. 100% free institutional download.)*
Pair your spreadsheet with our comprehensive suite of free institutional trader utilities:
- Calculate position sizes with our Prop Firm Lot Size Calculator.
- Check consistency limits with our Prop Firm Consistency Calculator.
- Run Monte Carlo pass simulations with our Prop Firm Pass Probability Calculator.
Frequently Asked Questions
Why do prop firm traders fail without a trade journal?
Over 95% of un-journaled prop traders fail because they evaluate their trading based on emotional feelings and arbitrary dollar amounts rather than mathematical expectancy. Without a structured trade log, traders cannot identify which setups have a positive statistical edge, leading to erratic position sizing, revenge trading during drawdowns, and automated breaches of the 5% daily loss rule.
What are the most critical metrics to record in a trading journal?
An institutional trading journal must track standardized R-Multiples (units of risk) rather than nominal dollar gains, technical setup classification (such as Break of Structure or Order Block), trading session (London, New York, or Asian), entry and exit prices, exact dollar risk percentage (strictly 0.50% to 1.0% per trade), and emotional mindset before and after trade execution.
Is an Excel trading journal better than paid automated SaaS journals?
For serious prop traders, an Excel or Google Sheets trade journal provides complete data privacy, zero recurring monthly subscription costs ($30 to $50/month saved), and full mathematical customizability. Manually logging trades also builds tactile psychological discipline and forces the trader to confront each execution decision, which automated software scrapers fail to cultivate.
How does trade journaling protect against daily drawdown breaches?
A structured trade journal calculates your exact remaining daily drawdown buffer before you execute a trade. By logging each closed position, you immediately see your cumulative session P&L in real time. If your journal indicates that you have taken two consecutive 1R losses (-2%), you know you must stop trading immediately rather than risking an emotional tilt that breaches the prop firm's 5% daily equity ceiling.
Written by the LaunchPropFirm Technical Analysis & Risk Architecture Desk.
Evaluate Your Prop Firm Readiness Score (0-100)
Answer 5 quick operational questions about your acquisition channels, runway, and engine tech to get a personalized launch roadmap.

M.Haris
Founder & Platform ArchitectBuilding open prop trading software infrastructure for operators worldwide
I built LaunchPropFirm to give forex educators, trading communities, and fintech operators complete ownership of their platform with full source code and zero monthly SaaS rent. Every article on this blog is drawn from hands-on platform development, live MT5 risk bridge mechanics, and real operator economics.
All content, financial models, ROI estimates, and architecture guides on LaunchPropFirm are published strictly for educational and informational purposes. LaunchPropFirm provides institutional prop trading software and technology infrastructure; it does not operate as a broker, custodian, or registered investment advisor.
Evaluation challenges and funded trader accounts referenced in this guide operate in simulated demo trading environments using real-time market data feeds. Simulated trading results do not represent actual trading performance or financial advice.
Recommended Next Reads
Hand-picked operator guides to scale your prop trading platform.
Most Successful Day Traders: Strategies, Math & Risk Rules
Study the most successful day traders in history and modern prop trading. Learn their position sizing math, win rates, R-multiples, and risk rules.
Is Day Trading Hard? Why 95% Fail & The Math Explained
Discover why 95% of day traders fail, the mathematical reality of leverage drag, and how funded evaluation accounts cap your personal downside risk.
Skip the monthly fees
Own your prop firm platform outright. One time purchase.
Full source code. Live in 7 days. No revenue share. No monthly SaaS bill. See the exact platform before paying anything.
Demo login: haris / asdf1122. No signup needed