Bullish Reversal Patterns: Candlesticks & Day Trading PDF
Master top bullish reversal patterns in 2026. Explore hammers, engulfing candles, false breakout traps, risk math, and free day trading PDF cheat sheet.
Why do most retail traders fail when attempting to trade bullish reversal patterns during prop firm challenges?
They fail because they spot a textbook hammer candle or an engulfing bar in the middle of nowhere and immediately click buy.
They treat candlestick shapes as automatic signals rather than structural clues within an institutional liquidity framework.
In professional proprietary trading, an isolated candlestick means nothing without location and order flow confirmation.
Institutional algorithms routinely create deceptive rejection wicks to engineer liquidity before pushing prices lower.
Understanding how to filter valid reversal patterns from retail liquidity traps is what separates funded traders from perpetual evaluation buyers.

1. What Are Bullish Reversal Patterns in Trading?
A bullish reversal pattern is a technical formation signaling that an established downtrend is losing momentum and that buyers are taking control.
These patterns occur across single-candle formations, multi-candle clusters, and structural chart geometry at key support boundaries.
They provide objective entry triggers and define structural invalidation levels for professional risk management.
Price action patterns do not cause market turns.
Turns occur when institutional limit orders absorb selling and initiate upward displacement.
The candlestick pattern is simply the footprint of that liquidity exchange.
Structural Context vs Isolated Candlestick Shapes
Executing every bullish pattern on a chart guarantees a rapid breach of your daily loss limits.
To qualify as an institutional setup, a pattern must satisfy three contextual prerequisites:
- Established Prior Downtrend: A reversal requires an existing bearish market structure to reverse.
- Key Liquidity or Demand Zone: The pattern must form at a higher-timeframe support level, order block, or discount equilibrium zone.
- Session Timing Alignment: The formation must occur during high-volume sessions like London Open or New York Overlap.
You can study the structural mechanics of trend transitions in our guide on when does a bearish market become bullish in forex.
2. Top 5 Bullish Reversal Candlestick Patterns
Professional traders rely on five high-probability candlestick formations to time demand zone entries.
Each pattern reflects a distinct shift in the balance of power between buyers and sellers.
1. The Hammer (Demand Pin Bar)
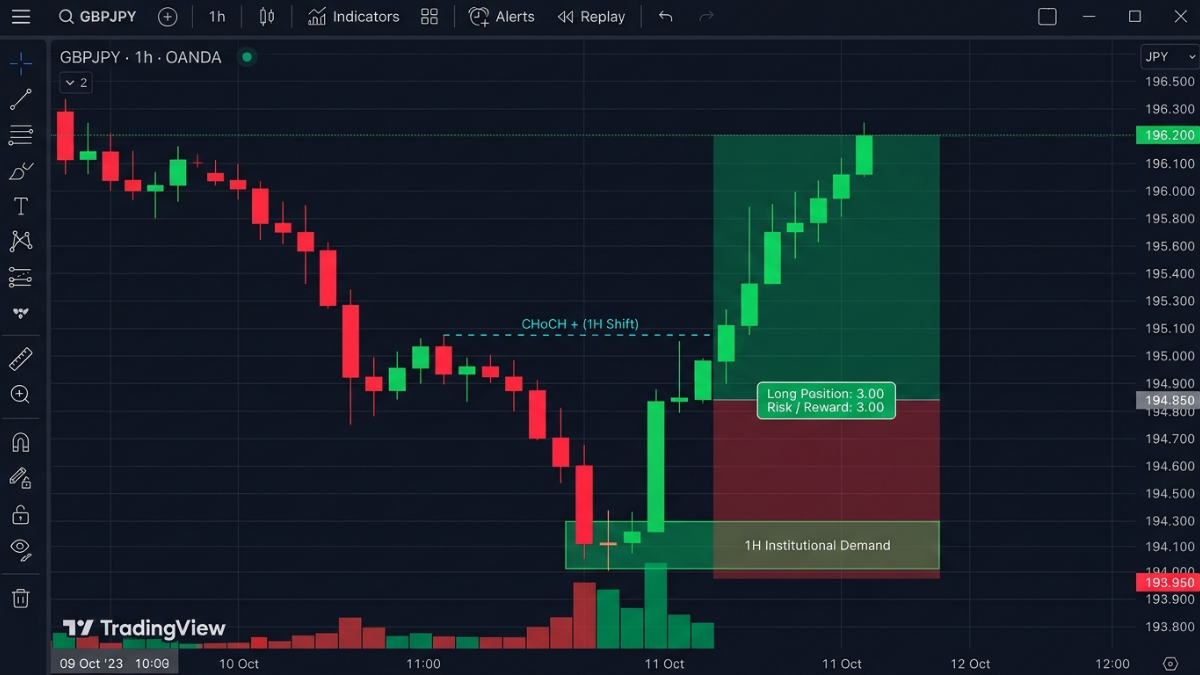
The hammer is a single-candle bullish reversal formation characterized by a small real body at the top of the range and a long lower shadow.
The lower wick must measure at least twice the height of the candle body, with little to no upper shadow.
This shows sellers drove prices lower during the session, but buyers completely rejected those levels.
In institutional terms, the lower shadow represents a sell-side liquidity sweep below key support.
Once resting stop orders are absorbed, institutional buying drives price back upward to close near session highs.
Place your stop loss below the low of the hammer wick and verify exposure using our free lot size calculator.
2. Bullish Engulfing (Two-Candle Momentum Shift)
The bullish engulfing pattern consists of a small bearish candle followed immediately by a large green candle that completely engulfs the prior body.
The second candle opens at or below the previous close and rallies aggressively to close well above the first candle open.
This indicates an immediate, decisive transfer of control from sellers to buyers.
For optimal reliability, the engulfing candle should display strong volume expansion and a full-bodied close with minimal upper wick.
When this occurs at an established higher-timeframe demand zone, it marks high-probability upward continuation.
Calculate your potential dollar risk and target profit in advance with our profit loss calculator.
3. The Morning Star (Three-Candle Transition)
The morning star is a classic three-candle reversal pattern that develops across three consecutive sessions:
- Candle 1: A tall bearish candle confirming the ongoing downtrend.
- Candle 2: A small-bodied candle (star or doji) indicating indecision and selling exhaustion.
- Candle 3: A strong bullish candle that closes more than 50% into the body of the first candle.
This three-stage sequence visually documents the exhaustion of supply and the arrival of aggressive buyer displacement.
It provides one of the highest statistical win rates among all multi-candle reversal formations on major currency pairs.
4. Piercing Line (Short Squeeze Rebound)
The piercing line is a two-candle reversal formation that frequently appears in volatile markets like Gold and equity indices.
The first candle is a long red bar, followed by a second green candle that opens below the low of the first bar.
The second candle then rallies vigorously to close above the 50% midpoint of the prior red candle body.
This formation demonstrates that aggressive sellers were trapped when the market failed to sustain lower prices.
If you trade commodity contracts like XAU/USD, review our institutional guide on gold trading hours to execute this pattern during peak liquidity windows.
5. Inverted Hammer (Pre-Breakout Pressure)
The inverted hammer features a small body at the lower end of the range with an upper wick at least twice the body height.
The upper wick reveals buyers tested higher prices against prevailing selling.
A confirmation candle closing above the pattern high verifies that supply has dried up.
3. Downloadable Day Trading PDF Cheat Sheet Framework
To build consistency across funded challenge attempts, disciplined traders use a standardized pre-trade checklist.
You can download our complete structured curriculum inside our forex trading for beginners pdf guide.
The 4-Step Reversal Verification Checklist
Before opening an order ticket on MT5 or TradingView, execute this four-step verification sequence:
- Identify Higher-Timeframe Liquidity: Mark previous daily highs, weekly lows, and Asian session ranges on the 4-hour and 1-hour charts.
- Wait for the Liquidity Run: Allow institutional algorithms to sweep resting retail stop orders below structural support.
- Confirm the Candlestick Trigger: Look for a closed hammer, bullish engulfing, or morning star on the 15-minute or 5-minute timeframe.
- Calculate Position Size: Measure the distance from entry to invalidation and cap total account risk at 1.0% maximum.
Following this systematic protocol prevents emotional revenge entries and keeps your challenge accounts within maximum drawdown boundaries.
You can model overall drawdown limits and challenge buffers with our prop firm drawdown calculator.
4. Retail Traps: Why 90% of Pattern Traders Get Swept
Textbook candlestick patterns fail on retail accounts due to market micro-structure and algorithmic order routing.
The Liquidity Sweep Trap Below Support
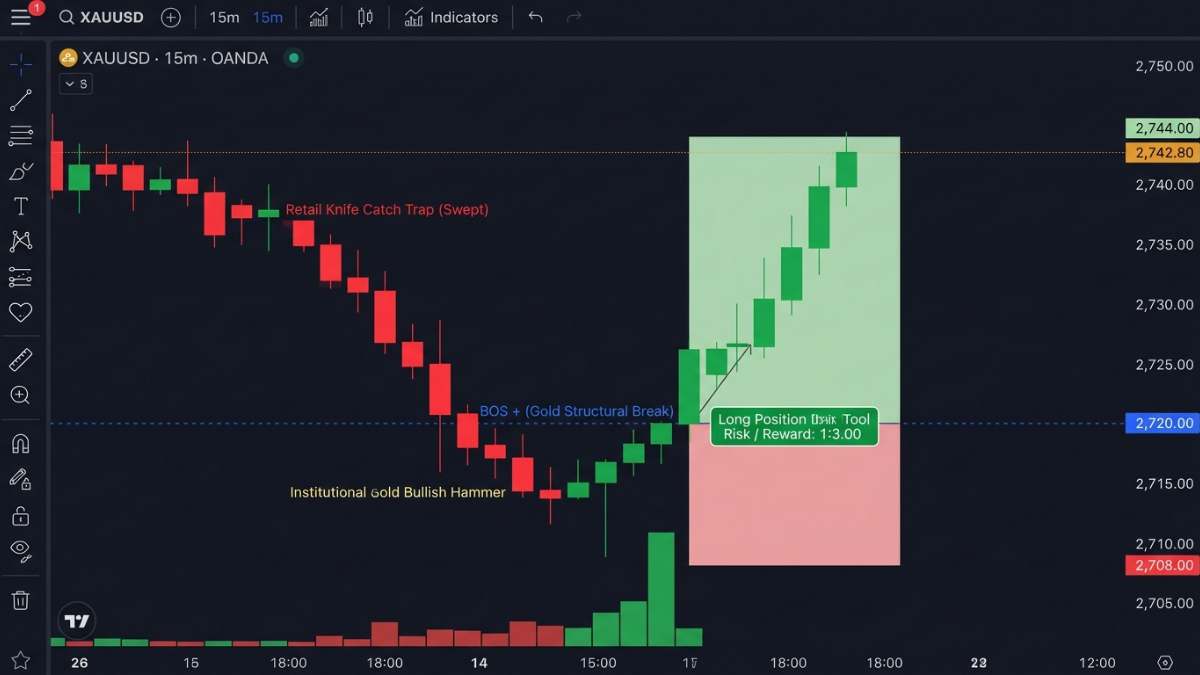
Retail chartists are taught to place buy limit orders right at obvious support lines with stop losses just a few pips below the swing low.
Institutional liquidity providers can see these clustered orders in the market depth.
They deliberately push prices through support, trigger retail stop-loss market sell orders, and accumulate long inventory at discounted prices.
A retail trader sees their stop hit and assumes the market is breaking down.
Moments later, a massive hammer prints as price rallies 100 pips without them.
Professional prop traders avoid this trap by waiting for the sweep to complete before entering on the confirmed pattern close.
Execution Timing: Multi-Timeframe Alignment
Trading a reversal pattern on a 1-minute chart against an aggressive 4-hour downtrend is financial suicide.
A 1-minute hammer in a strong 4-hour drop is merely a temporary pause before the next sell leg resumes.
Always align lower-timeframe entry patterns with higher-timeframe support zones.
Explore our foundational framework inside our how to learn how to day trade guide to master top-down market analysis.
5. Quantitative Position Sizing & Invalidation Rules
Professional trading is not about predicting market direction with certainty.
It is about structuring trades so that winning setups yield twice as much as losing setups while preserving capital.
Stop Loss Placement and the 1% Capital Rule
A valid pattern must provide an undeniable invalidation level.
If price trades below the lowest wick of your reversal pattern, the bullish premise is proven false and you must exit immediately.
Consider a 2.0 standard lot long position on EUR/USD triggered by a morning star:
- Entry Price: 1.0850
- Pattern Invalidation Stop Loss: 1.0825 (25 pips risk)
- Take-Profit Target: 1.0925 (75 pips profit, 1:3 Risk-to-Reward ratio)
On a $50,000 evaluation account, a 25-pip stop on a 2.0 lot position represents $500 risk, exactly 1.0% of your starting balance.
If the trade hits target, you secure +$1,500 profit, pushing you within striking distance of funded certification.
Verify pip values across different currency tiers with our institutional forex lot size chart.
6. How Prop Firm Operators Use Automated Reversal Sentinels
Behind modern retail broker portals, prop firm operators utilize institutional risk sentinels to monitor trader exposure in real time.
When thousands of traders enter simultaneous reversal positions on major news releases, platform bridges experience intense volume spikes.
Legacy SaaS platforms often freeze or disconnect, leaving firm founders vulnerable to execution disputes and liquidity deficits.
LaunchPropFirm solves this vulnerability by providing turn-key self-hosted software with integrated real-time risk engines.
Rather than paying $3,000 to $6,000 every month in recurring SaaS fees, operators receive 100% source code ownership for $2,495 one-time.
Our platform includes native TradingView charting, sub-50ms MT5 price bridges, and automated trailing drawdown sentinels.
Explore our white label prop firm software architecture and inspect live admin dashboards at demo.launchapropfirm.com.
Frequently Asked Questions
What is the most reliable bullish reversal pattern?
The morning star and the bullish engulfing pattern deliver the highest statistical reliability because they require multiple candles to confirm supply exhaustion and buyer displacement.
How do you confirm a bullish reversal before entering?
Wait for the reversal candle to close completely, verify that the formation occurred at a higher-timeframe support zone, and confirm that trading volume expanded during the reversal.
What is the difference between a hammer and an inverted hammer?
A hammer has a long lower wick showing rejection of lower prices, while an inverted hammer has a long upper wick showing that buyers tested higher levels before seller exhaustion.
Where should stop loss be placed on a bullish reversal?
Place your defensive stop loss two to five pips below the lowest wick of the pattern to ensure that structural invalidation closes the trade before unnecessary drawdown accumulates.
Can you trade bullish reversal patterns on a prop firm evaluation?
Yes, bullish reversal patterns are fully allowed in prop firm challenges provided you follow daily loss limits, maximum drawdown caps, and position sizing rules.
Evaluate Your Prop Firm Readiness Score (0-100)
Answer 5 quick operational questions about your acquisition channels, runway, and engine tech to get a personalized launch roadmap.

M.Haris
Founder & Platform ArchitectBuilding open prop trading software infrastructure for operators worldwide
I built LaunchPropFirm to give forex educators, trading communities, and fintech operators complete ownership of their platform with full source code and zero monthly SaaS rent. Every article on this blog is drawn from hands-on platform development, live MT5 risk bridge mechanics, and real operator economics.
All content, financial models, ROI estimates, and architecture guides on LaunchPropFirm are published strictly for educational and informational purposes. LaunchPropFirm provides institutional prop trading software and technology infrastructure; it does not operate as a broker, custodian, or registered investment advisor.
Evaluation challenges and funded trader accounts referenced in this guide operate in simulated demo trading environments using real-time market data feeds. Simulated trading results do not represent actual trading performance or financial advice.
Recommended Next Reads
Hand-picked operator guides to scale your prop trading platform.
Breaker Block Trading Strategy: How to Trade Block Failures
Master the breaker block trading strategy. Learn how failed order blocks create high-probability liquidity retests with exact entry, stop loss, and RR rules.
Advantages of Forex Trading: 2026 Benefits & Risk Guide
Explore the core advantages of forex trading in 2026. Master 24/5 liquidity, leverage mechanics, major currency pairs, and the risk reality.
Community Monetization & Platform Ownership
Run a Trading Discord, Telegram, or Signal Group? Launch Your Own Prop Firm in 7 Days.
Stop sending your community to third-party prop firms. Own our complete white-label prop firm platform with all automated risk engines, live TradingView charts, MT5 bridge, and paid tournament engine from just $995 down under 50% milestone escrow. Zero monthly SaaS fees.