How to Learn How to Day Trade: 2026 Step-by-Step Blueprint
Master day trading in 2026 with a proven 5-stage roadmap. Learn market mechanics, 1% risk rules, demo forward-testing, and funded challenge protocols.
Ask any veteran risk manager on an institutional trading desk what separates consistently profitable day traders from the 95% who wash out within ninety days, and they will not point to a proprietary indicator, a secret candlestick pattern, or an expensive private chatroom. They will point to a disciplined, sequenced learning curve that systematically eliminates catastrophic downside risk while an asymmetric mathematical edge is developed.
Most retail traders attempt to learn day trading backwards. They fund a live retail brokerage account with thousands of dollars of hard-earned personal capital, watch a handful of retail YouTube tutorials on moving average crossovers, and begin placing oversized orders in volatile market sessions. Within a few weeks, an inevitable string of consecutive losses triggers emotional revenge trading, the account is completely liquidated, and the trader concludes that financial markets are rigged.
Learning how to day trade successfully in 2026 requires abandoning retail gambling habits and adopting an institutional engineering protocol. Whether you plan to trade foreign exchange currency pairs, synthetic equity indices, or cryptocurrency CFDs on modern browser terminals like TradingView or cTrader, this comprehensive guide provides the exact five-stage blueprint used by professional operators to progress from zero market experience to consistent, funded capital withdrawals.
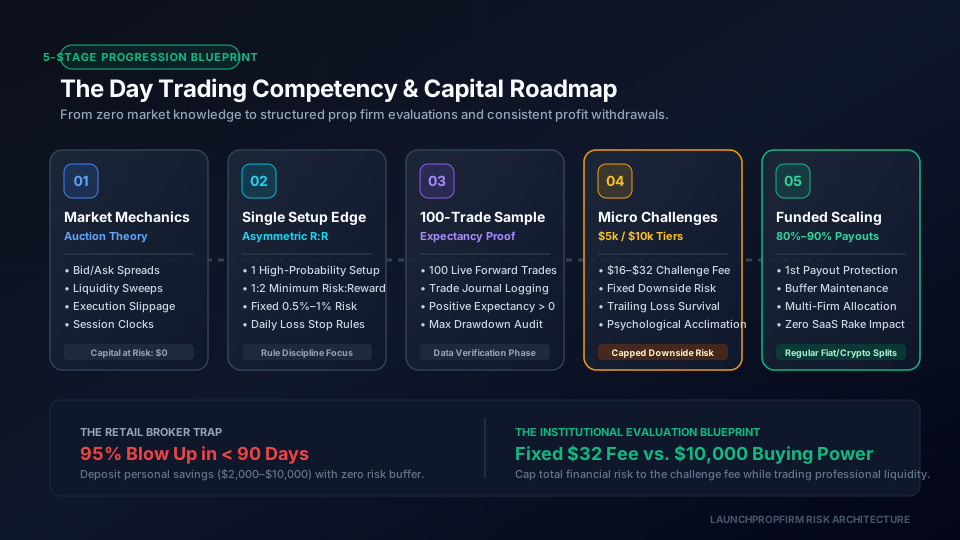
5-Stage Day Trading Competency & Capital Progression Matrix
Before risking a single dollar in live financial markets, every trader must understand the exact milestones, capital requirements, and failure criteria across each development phase. The following operational matrix outlines the structured journey from market simulation to funded professional execution:
| Development Stage | Primary Focus | Capital at Risk | Target Duration | Core Milestone to Graduate |
|---|---|---|---|---|
| Stage 1: Market Mechanics | Auction theory, bid-ask spreads, order flow & session clocks | $0 (Demo terminal) | 2 to 4 Weeks | Flawless manual order execution with zero input errors |
| Stage 2: Single Edge Mastery | 1 mechanical setup with minimum 1:2 risk-to-reward ratio | $0 (Paper simulation) | 4 to 6 Weeks | Documented positive mathematical expectancy over 50 trades |
| Stage 3: 100-Trade Forward Test | Trade journaling, emotional discipline & drawdown tracking | $0 (Demo account) | 6 to 8 Weeks | 100 consecutive trades executed strictly adhering to risk rules |
| Stage 4: Micro Evaluation | Trailing drawdown survival & challenge target discipline | $16 to $32 (Challenge fee) | 4 to 8 Weeks | Passing a $5,000 or $10,000 prop firm evaluation phase |
| Stage 5: Funded Scaling | Payout preservation, buffer building & multi-firm routing | $0 personal capital | Ongoing | Securing first profit split and scaling through performance tiers |
The Retail Day Trading Trap: Why 90% of YouTube Tutorials Guarantee Failure
The retail day trading educational industry is heavily incentivized to promote dangerous misconceptions. Unregulated educational influencers earn substantial affiliate commissions when beginner retail traders register with high-leverage offshore CFD brokers and rapidly churn through deposits. As a direct consequence, retail tutorials routinely emphasize high win rates, flashy five-minute scalp indicators, and overnight wealth accumulation while completely ignoring liquidity distribution, commission drag, and position sizing mathematics.
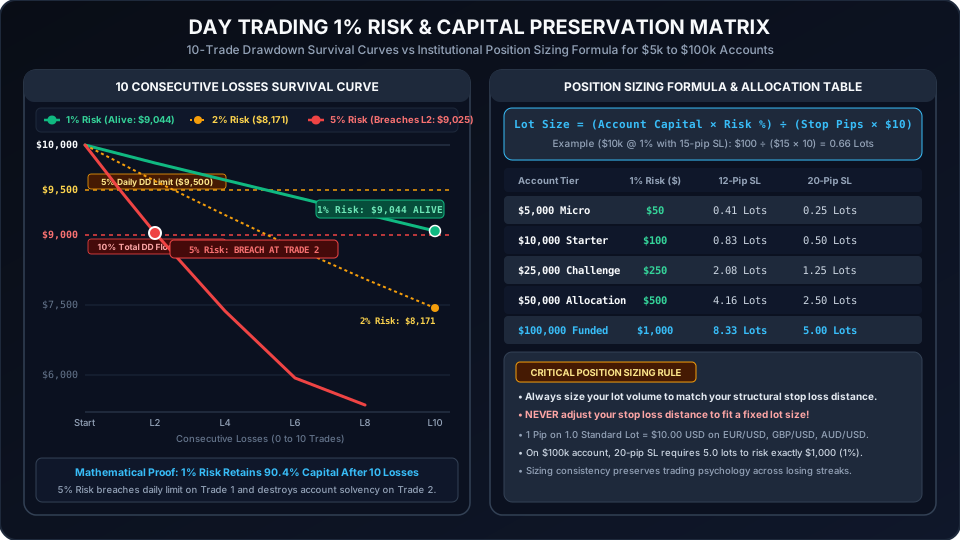
In reality, academic research into retail market participants demonstrates that over 90% of day traders lose money over a twelve-month horizon. As detailed in our operational breakdown on is day trading hard, the primary culprit is not a lack of market prediction ability, but rather an inability to survive standard statistical variance. When an uneducated trader risks 5% or 10% of their total account balance on a single trade, a routine cluster of four consecutive losses destroys 20% to 35% of their purchasing power.
To escape this statistical trap, prospective day traders must understand that trading is fundamentally an exercise in risk engineering. Your primary objective during your first six months is not to generate life-changing income, but to preserve your capital and build verifiable psychological and mathematical discipline.
Stage 1: Market Mechanics, Order Types, and Auction Economics
Every market participant must begin by understanding how electronic financial markets actually function beneath the surface of a candlestick chart. Financial charts do not move because of trendlines, moving average bounces, or geometric shapes; they move because of dynamic changes in liquidity and the execution of aggressive market orders against passive limit orders.
Understanding the Bid-Ask Spread and Hidden Execution Costs
When executing trades on MetaTrader 5, cTrader, or TradingView web terminals, every order is subject to commercial friction consisting of the bid-ask spread and broker commissions. The bid is the highest price a buyer is currently willing to pay, while the ask is the lowest price a seller is willing to accept.
For short-term day traders holding positions for minutes or hours, spread costs represent a major mathematical hurdle. If you trade EUR/USD with a 1.2 pip spread and aim for a 6 pip profit target, the spread alone consumes 20% of your total expected profit potential. Understanding raw spread liquidity and avoiding illiquid session rollovers (such as the 5:00 PM New York bank settlement window) is mandatory to prevent unnecessary capital bleed.
Liquidity Sweeps vs True Trend Continuation
Financial markets are designed to facilitate trading between buyers and sellers at efficient volume nodes. Institutional participants, central banks, and market makers cannot execute large positions without sufficient counterparty volume. Therefore, price frequently navigates toward obvious retail stop-loss clusters located directly above equal highs or below equal lows to engineer liquidity.
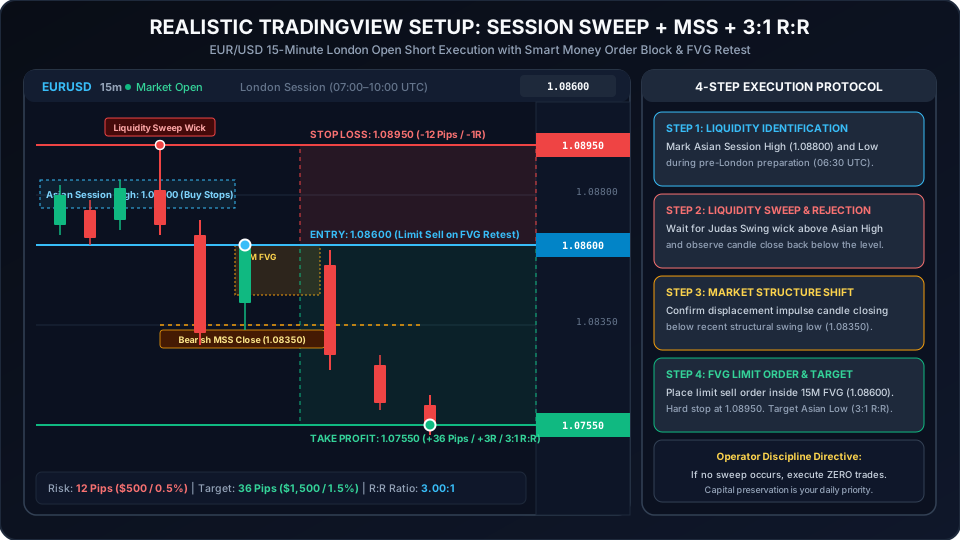
Beginners who buy market breakouts above obvious resistance levels routinely find themselves trapped in false breakouts, often referred to as liquidity sweeps or stop runs. As detailed in our breakdown of break of structure examples, professional day traders wait for the liquidity sweep to occur first, followed by an aggressive market displacement and structural shift, before committing capital.
Session Timing: London Open, New York Silver Bullet & Asian Range
Day trading requires volatility and volume. Attempting to day trade during dead market hours results in choppy consolidation and high spread costs. Reviewing our institutional guide on the best time to trade forex reveals how the global foreign exchange and CFD market operates across three primary daily sessions:
- The Asian Session (Tokyo/Sydney): Characterized by lower volatility and defined trading ranges. Professional traders frequently map the high and low of the Asian range as potential liquidity targets for subsequent sessions.
- The London Session: Delivers the primary liquidity injection of the trading day. London market makers often expand the daily range and establish the directional trend for European currencies.
- The New York Session: The highest volume window of the twenty-four hour cycle, particularly the overlap period with London between 8:00 AM and 12:00 PM Eastern Standard Time. Key high-impact macroeconomic data releases (such as US Non-Farm Payrolls, CPI inflation reports, and FOMC rate decisions) inject massive market participation during this window.
Beginners should select exactly one specific two-hour window each day (for example, the London Open from 3:00 AM to 5:00 AM EST or the New York morning session from 9:30 AM to 11:30 AM EST) and specialize exclusively in that market environment.
Skip the monthly fees
Own your prop firm platform outright. One time purchase.
Full source code. Live in 7 days. No revenue share. No monthly SaaS bill. See the exact platform before paying anything.
Demo login: haris / asdf1122. No signup needed
Stage 2: Developing One Mechanical Setup with Asymmetric Risk-Reward
One of the most destructive habits of novice traders is system hopping. When a beginner experiences two consecutive losing trades using a support-and-resistance strategy, they immediately discard the playbook and search for an RSI divergence system, then an order block indicator, and then a MACD crossover bot. This cycle prevents the trader from ever gathering a statistically meaningful sample size.
The Myth of Multi-Indicator Confirmation Systems
Layering five lagging indicators onto a single price chart does not improve predictive accuracy; it produces cognitive paralysis. When your moving average signals a buy, your stochastic oscillator signals oversold, and your volume profile signals neutral, you are forced to make subjective emotional decisions under pressure.
Professional day traders build robust trading systems around a single, rules-based setup with clearly defined parameters:
- Exact market condition required (trend continuation or mean reversion).
- Objective entry trigger (such as a 15-minute fair value gap fill or break of structure).
- Non-negotiable structural invalidation point for the stop loss.
- Predetermined liquidity target for full or partial profit extraction.
The Mathematics of a 40% Win Rate with 1:2.5 Risk-Reward
Retail traders obsess over achieving an 80% or 90% win rate, believing that profitability stems from being right on almost every trade. In institutional trading desks, many of the most successful trading books operate with win rates between 35% and 45%.
The secret lies in asymmetric risk-to-reward ratios. Consider the mathematical outcome of 100 trades with a modest 40% win rate and an average risk-to-reward ratio of 1:2.5, risking a fixed $200 per trade:
- 60 Losing Trades: 60 x -$200 = -$12,000 loss
- 40 Winning Trades: 40 x +$500 = +$20,000 gain
- Net Realized Profit: +$8,000
Even though the trader was wrong on 60 out of 100 executions, the asymmetric payoff structure generated substantial net profitability. When you trade with positive expectancy, individual trade outcomes cease to carry emotional weight. You can model your potential growth curve using our prop firm calculator to see how small improvements in risk-to-reward dramatically alter long-term capital accumulation.
Hard Stop Loss Invariant: Sizing by Pips, Not Fixed Lots
Never open a day trade without an immediate, automated stop-loss order placed with your broker. Hoping that a losing trade will turn around or manually waiting to close a position is the single fastest way to suffer a catastrophic account breach.
Furthermore, novice traders frequently commit the fatal error of trading fixed lot sizes (such as entering exactly 1.0 lot on every trade regardless of stop-loss distance). If your stop loss on one trade is 10 pips and on another trade is 40 pips, a 1.0 lot position risks $100 on the first trade and $400 on the second trade, completely corrupting your risk profile.
Instead, calculate your position size dynamically using our free lot size calculator. Determine your entry price, place your stop loss behind structural market invalidation, calculate the distance in pips or points, and size your lot volume so that you risk exactly 0.5% to 1.0% of your current account balance.
Stage 3: The 100-Trade Simulation & Trade Journaling Protocol
You would never attempt to perform open-heart surgery after reading a single medical textbook, nor would an airline allow a pilot to fly a commercial passenger jet without hundreds of hours in a flight simulator. Yet thousands of retail participants deposit live capital into trading accounts having never executed a single disciplined series of paper trades.
Stage 3 requires executing exactly 100 forward-tested trades in a live simulation environment with zero real money at risk. Forward testing means taking trades in real-time as market candles form, rather than scrolling backwards through historical charts with hindsight bias.
Why Paper Trading Must Precede Any Live Capital Commitment
Paper trading on a modern browser terminal allows you to master software mechanics without financial stress:
- You learn how to set bracket orders (stop loss and take profit simultaneously).
- You experience execution latency and spread widening during economic news events.
- You discover how your personal schedule and psychology respond to managing open positions.
- Most importantly, you verify whether your mechanical edge actually delivers positive expectancy in live market conditions.
If you cannot maintain emotional discipline and follow your trading rules when paper trading with zero financial pressure, you have zero chance of maintaining discipline when thousands of dollars of your personal savings are on the line.
Three Core Metrics: Expectancy, Profit Factor & Maximum Drawdown
Every forward test must be recorded in an analytical trade journal. As detailed in our guide to maintaining a free trade journal, you must track three primary statistical health indicators:
- Mathematical Expectancy: The average dollar amount you expect to win or lose per trade over time:
Expectancy = (Win Rate x Average Win) - (Loss Rate x Average Loss)
- Profit Factor: Gross profits divided by gross losses. A robust, sustainable day trading system maintains a profit factor of 1.6 or higher across a 100-trade sample.
- Maximum Drawdown: The peak-to-trough decline in your equity curve. Knowing your maximum historical drawdown allows you to verify that your strategy can comfortably survive strict prop firm evaluation limits.
Once you have completed 100 simulated trades with positive expectancy and an acceptable maximum drawdown, you have graduated from theoretical learning to verifiable execution capability.
Stage 4: Transitioning to Simulated Funded Micro-Challenges ($5k/$10k)
Once you have verified your edge in paper trading, the traditional advice has always been to open a live brokerage account with your own savings. However, in 2026, risking personal capital as a beginner is an obsolete and financially dangerous practice.
As analyzed in our comprehensive research on how much money do you need to start day trading, opening a personal brokerage account with $500 or $1,000 creates immense psychological pressure. To earn a meaningful dollar return on a small $500 account, the trader is forced to over-leverage, which virtually guarantees an account blowout within weeks.
Capping Financial Ruin: The $32 Fee vs $5,000 Personal Broker Deposit
Modern prop firm evaluation models have revolutionized the learning pathway for retail day traders. Instead of depositing $5,000 of your personal savings into a retail broker and risking 100% capital destruction, you can purchase a simulated $5,000 or $10,000 challenge account for an upfront fee of approximately $16 to $32.
This asymmetric structure completely caps your financial downside:
- Maximum Financial Risk: The $16 to $32 one-time challenge fee. If you breach a drawdown limit, your losses are strictly limited to the fee paid; you can never lose your house, your savings, or fall into debt.
- Controlled Risk Environment: The evaluation enforces strict institutional rules, such as a 5% maximum daily loss limit and a 10% maximum total loss limit.
- Institutional Capital Access: Once you demonstrate that you can achieve an 8% to 10% profit target while respecting drawdown boundaries, the firm provides you with a funded simulated account where you retain 80% to 90% of all generated trading profits.
Surviving Daily Loss Limits and Trailing Drawdown High-Water Marks
The primary hurdle for day traders transitioning to prop evaluations is adapting to daily loss and trailing drawdown mechanics. A prop firm daily loss limit is typically calculated at midnight server time based on starting equity or balance, whichever is higher.
If you trade recklessly during high-volatility news events or revenge trade after an early morning loss, automated risk engines will terminate your account the instant the daily limit is breached. Furthermore, many modern firms enforce consistency rules to ensure that a trader does not pass a challenge through a single lucky trade. You can verify your daily consistency buffer and payout eligibility in real time using our interactive prop firm consistency calculator.
Stage 5: Consistency, Capital Scaling, and Institutional Allocation
Passing an evaluation challenge and receiving your first funded certificate is an impressive milestone, but maintaining funded status over six to twelve months requires an entirely different operational mindset.
The First Payout Protection Rule
The single most critical objective upon receiving a funded account is securing your first profit withdrawal. When you reach funded status, your account balance sits directly on the total drawdown floor. For example, on a $50,000 account with a 10% maximum drawdown ($5,000 loss limit), your account is breached if your balance drops below $45,000.
Until you accumulate a positive profit buffer, every trade carries maximum existential risk. Professional traders cut their position sizing in half (from 1% risk down to 0.5% risk) until they build a 2% to 4% safety cushion above the starting balance. Once your first payout is approved and disbursed via bank wire, Wise, or cryptocurrency rails, your initial challenge fee is typically refunded, meaning you are now trading purely on institutional house money.
Multi-Firm Diversification: Eliminating Single-Point Platform Risk
Experienced funded traders never rely on a single prop firm or broker. Prop firms operate under distinct regulatory jurisdictions, utilize different liquidity providers (such as MetaQuotes MT5, Spotware cTrader, or DXtrade), and enforce varying payout schedules.
By allocating your trading strategy across three or four vetted proprietary trading firms, you diversify your operational exposure. If one firm experiences technical downtime or delayed payout processing, your remaining funded allocations continue to generate cash flow uninterrupted.
The Operator Perspective: How Prop Firms Manage Trader Risk
Understanding how proprietary trading platforms operate behind the scenes provides immense clarity on why specific trading rules are enforced. When you understand the operational mechanics of the business, you stop viewing risk parameters as unfair restrictions and begin recognizing them as institutional solvency protocols.
Modern proprietary trading firms running on self-hosted technology stacks like LaunchPropFirm utilize advanced automated risk desks. As demonstrated in our platform administrative portals, the software monitors several core parameters across thousands of concurrent trader accounts in real time:
- Automated Balance vs Equity Monitors: Instantly liquidates open market positions if trailing equity touches the predetermined high-water mark floor.
- News Guard Engine: Flags accounts that open aggressive speculative positions within two minutes of high-impact macroeconomic releases.
- Syndicate and Latency Arbitrage Radars: Identifies accounts executing synchronized tick scalping or copy-trading signals across multiple challenge accounts.
Prop firm operators do not profit from good traders failing; they profit from building sustainable volume and sharing substantial profits with disciplined, risk-managed market participants. Entrepreneurs looking to launch their own white-label platform can review our itemized prop firm cost breakdown to see how modern self-hosted software eliminates monthly SaaS rental fees and provides full risk management control.
Frequently Asked Questions About Learning How to Day Trade
How long does it realistically take to learn how to day trade?
For most dedicated individuals committing ten to fifteen hours per week, achieving verifiable mechanical discipline and positive expectancy requires four to six months of structured simulation and paper trading. Expecting to generate consistent live income within your first thirty days is unrealistic and statistically leads to immediate capital wipeout.
How much money do I need to start learning day trading?
You can start learning day trading with exactly zero dollars using free web charting platforms like TradingView and demo accounts provided by regulated brokers. When you are ready to transition to real market stakes, you should utilize micro prop firm evaluation challenges ($5,000 or $10,000 accounts costing between $16 and $32) rather than depositing large sums of personal savings.
Which financial market is best for beginner day traders?
Major foreign exchange currency pairs (such as EUR/USD, GBP/USD, and USD/JPY) and broad liquid equity index CFDs (such as the S&P 500 and Nasdaq 100) are optimal for beginners. These instruments offer tight bid-ask spreads, deep institutional liquidity, and reliable structural price behavior during London and New York market hours.
What is the most important rule in day trading?
The most important rule in day trading is non-negotiable risk containment. Never risk more than 0.5% to 1.0% of your total account balance on any single trade, always place an automated stop-loss order at the moment of entry, and stop trading for the day immediately if you hit your maximum daily loss threshold.
Evaluate Your Prop Firm Readiness Score (0-100)
Answer 5 quick operational questions about your acquisition channels, runway, and engine tech to get a personalized launch roadmap.

M.Haris
Founder & Platform ArchitectBuilding open prop trading software infrastructure for operators worldwide
I built LaunchPropFirm to give forex educators, trading communities, and fintech operators complete ownership of their platform with full source code and zero monthly SaaS rent. Every article on this blog is drawn from hands-on platform development, live MT5 risk bridge mechanics, and real operator economics.
All content, financial models, ROI estimates, and architecture guides on LaunchPropFirm are published strictly for educational and informational purposes. LaunchPropFirm provides institutional prop trading software and technology infrastructure; it does not operate as a broker, custodian, or registered investment advisor.
Evaluation challenges and funded trader accounts referenced in this guide operate in simulated demo trading environments using real-time market data feeds. Simulated trading results do not represent actual trading performance or financial advice.
Recommended Next Reads
Hand-picked operator guides to scale your prop trading platform.
Best Time to Trade Forex: 2026 Hours & Session Clocks
Discover the best time to trade forex in 2026. Explore London and New York session overlaps, hourly pip volatility, spread traps, and killer trade setups.
Free Trade Journal: Excel Spreadsheet Template & Guide
Download our free trade journal Excel template for prop firm traders. Track R-multiples, win rate, daily drawdown, and emotional discipline in 2026.
Skip the monthly fees
Own your prop firm platform outright. One time purchase.
Full source code. Live in 7 days. No revenue share. No monthly SaaS bill. See the exact platform before paying anything.
Demo login: haris / asdf1122. No signup needed