Forex Trading for Beginners PDF (Free 2026 Starter Guide)
Download the free forex trading for beginners PDF guide. Master currency pairs, pip math, lot sizing, risk rules, and funded trader evaluation roadmaps.
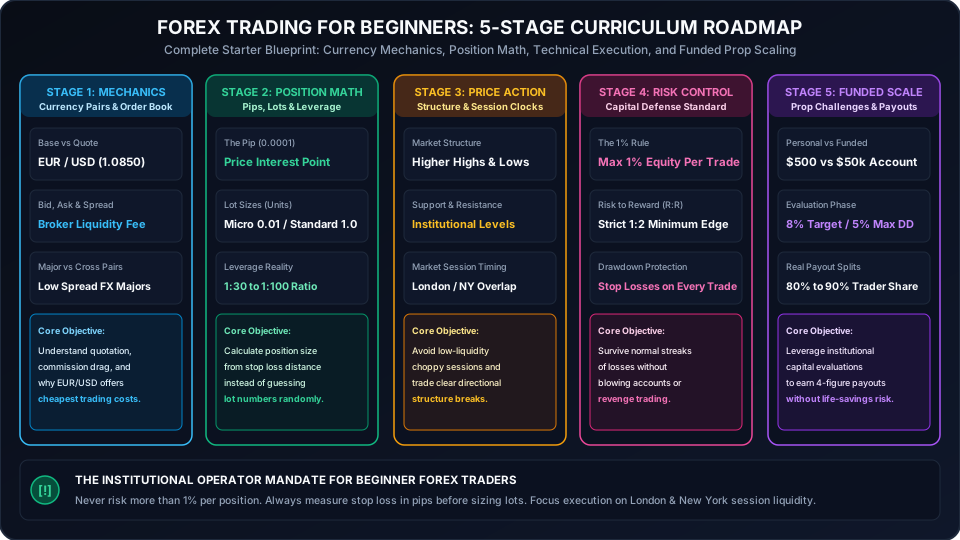
The Raw Truth: Why 90% of Forex Beginners Blow Accounts in 90 Days
The retail foreign exchange industry is flooded with marketing fantasies: overnight riches, luxury sports cars, and 95% win-rate algorithmic bots. In commercial brokerage operations, the cold mathematical reality is brutally consistent across decades of data: over 90% of retail beginners lose their entire deposited capital within the first 90 days.
This retail liquidation rate does not happen because the currency market is an unpredictable casino. It occurs because novice traders enter the market without understanding contract sizing, pip valuation, or drawdown mathematics. They risk 10% or 20% of their life savings on single impulsive trades, use 1:500 offshore leverage without measuring stop-loss distances, and suffer emotional paralysis during normal market volatility.
This forex trading for beginners PDF guide breaks down the exact operational curriculum used by institutional trading desks and proprietary trading firms. It strips away academic theory and provides an authentic, step-by-step blueprint covering currency mechanics, position sizing equations, structural price action, and modern funded trader pathways.
Module 1: The Currency Market Mechanics and Quotation Anatomy
The foreign exchange market is the largest, most liquid financial ecosystem in the world, processing over $7.5 trillion in daily transaction volume. Unlike centralized equities markets such as the New York Stock Exchange, foreign exchange has no physical central exchange. It operates as an Over-the-Counter (OTC) decentralized network of Tier-1 bullion banks, institutional liquidity providers, commercial multinational corporations, and retail brokerage bridges.
1. Base Currency vs Quote Currency
Every forex trade represents an exchange transaction: you simultaneously buy one currency while selling another. Consequently, currencies are always quoted in standardized pairs:
EUR / USD = 1.08500
[Base Currency] / [Quote Currency] = [Exchange Rate]
- The Base Currency (EUR): The first currency listed in the pair. It represents the standardized merchandise unit being bought or sold.
- The Quote Currency (USD): The second currency in the pair. It specifies how much of the quote currency is required to purchase exactly one unit of the base currency.
In the quote above, exactly 1.00 Euro is worth $1.08500 US Dollars. If you anticipate that economic data will strengthen the Euro relative to the Dollar, you execute a Buy (Long) order. If you project that the US Federal Reserve will raise interest rates or that European growth will decelerate, you execute a Sell (Short) order.
2. Bid, Ask, and the Spread: Your Primary Cost of Business
Every brokerage terminal displays two prices simultaneously:
EUR/USD -> Bid: 1.08500 | Ask: 1.08512
Spread = Ask - Bid = 0.00012 (1.2 Pips Broker Fee)
- The Bid Price: The price at which liquidity providers are willing to buy the base currency from you (the price you receive when opening a short position).
- The Ask Price: The price at which liquidity providers are willing to sell the base currency to you (the price you pay when opening a long position).
- The Spread: The difference between the Ask and Bid price. This is the immediate broker transaction fee charged upon order submission.
When you click "Buy", your trade immediately opens at a fractional loss equal to the broker spread. Beginners must prioritize low-spread major currency pairs (such as EUR/USD, GBP/USD, and USD/JPY) where institutional trading volume keeps spreads between 0.0 and 1.5 pips, avoiding exotic currency pairs where 10-pip to 30-pip spreads destroy trading expectancy.
3. Understanding Pips and Pipettes
In equities, price movement is measured in cents and dollars. In foreign exchange, price fluctuations are quantified in standardized units called pips ("Percentage in Point" or "Price Interest Point").
For virtually all currency pairs, 1 pip represents movement in the fourth decimal place (0.0001):
- If EUR/USD moves from 1.08500 to 1.08550, price has advanced by exactly 5.0 pips.
- If GBP/USD falls from 1.27200 to 1.26900, price has contracted by exactly 30.0 pips.
The exception is Japanese Yen currency pairs (such as USD/JPY, EUR/JPY, and GBP/JPY), where 1 pip is measured at the second decimal place (0.01):
- If USD/JPY rises from 154.20 to 154.60, price has expanded by 40.0 pips.
Most modern TradingView and MT5 terminals display a fifth decimal digit (or third digit on Yen pairs) known as a pipette (0.00001). Ten pipettes equal one full pip. For an exhaustive tier-by-tier contract breakdown, inspect our forex lot size chart reference guide.
Module 2: Margin, Leverage, and Lot Sizes: The Math That Saves Your Account
The most common trap for novice retail traders is misunderstanding leverage. Retail brokerages advertise 1:500 or 1:1000 leverage as a luxury feature that allows you to control massive wealth with a $100 deposit. In reality, uncalculated leverage is an account execution weapon that magnifies losses until automatic margin liquidations trigger.
1. Contract Sizes: Standard, Mini, and Micro Lots
In foreign exchange, trading volume is quantified in standardized contracts called lots:
| Lot Type | Volume Setting | Contract Units | EUR/USD Pip Value | Recommended Capital Tier |
|---|---|---|---|---|
| Standard Lot | 1.00 Lot | 100,000 Units | $10.00 / pip | $50,000 to $200,000 Funded |
| Mini Lot | 0.10 Lot | 10,000 Units | $1.00 / pip | $5,000 to $25,000 Challenge |
| Micro Lot | 0.01 Lot | 1,000 Units | $0.10 / pip | $500 to $2,500 Beginner |
| Nano Lot | 0.001 Lot | 100 Units | $0.01 / pip | Educational Sandbox / Bot Testing |
If a beginner deposits $500 into a personal brokerage account and opens a 1.00 Standard Lot position on EUR/USD, each pip movement equals $10.00. A routine 35-pip intraday pullback against their entry inflicts a -$350 loss, wiping out 70% of their net liquid wealth in twenty minutes. Understanding this relationship is non-negotiable.
2. The Dynamic Position Sizing Formula
Professional prop firm operators never guess their position size or trade arbitrary round lot numbers. They execute an objective mathematical equation that derives lot volume directly from their dollar risk limit and stop-loss distance:
Position Size (Lots) = Allowed Dollar Risk / (Stop Loss Distance in Pips * Pip Value per Standard Lot)
Step-by-Step Practical Example:
- Account Balance: $10,000 funded evaluation account
- Maximum Allowed Risk per Trade (1.0%): $100.00 USD
- Technical Stop Loss Distance: 20.0 Pips on EUR/USD
- Standard Pip Value: $10.00 per pip
Position Size = $100.00 / (20 pips * $10.00) = $100 / $200 = 0.50 Mini Lots
By executing exactly 0.50 lots, if the market triggers your stop loss at 20 pips, your realized loss is exactly -$100.00 (1.0% of your account). If your next setup requires a 40-pip stop loss, the formula automatically reduces your position size to 0.25 lots, keeping your maximum risk invariant.
To eliminate manual calculation errors during fast market volatility, calibrate your trades using our free prop firm lot size calculator. To understand how broker margin requirements and regulatory leverage caps impact your required collateral, review our comprehensive analysis of high leverage forex brokers.
Skip the monthly fees
Own your prop firm platform outright. One time purchase.
Full source code. Live in 7 days. No revenue share. No monthly SaaS bill. See the exact platform before paying anything.
Demo login: haris / asdf1122. No signup needed
Module 3: Reading Price Action: Market Structure and Trading Sessions
Beginners frequently clutter their trading charts with seven overlapping lagging indicators: MACD ribbons, RSI oscillators, Bollinger Bands, and stochastic crosses. When indicators conflict, emotional paralysis takes over. Institutional traders strip away lagging math and trade pure price action: market structure, key liquidity levels, and session volume.
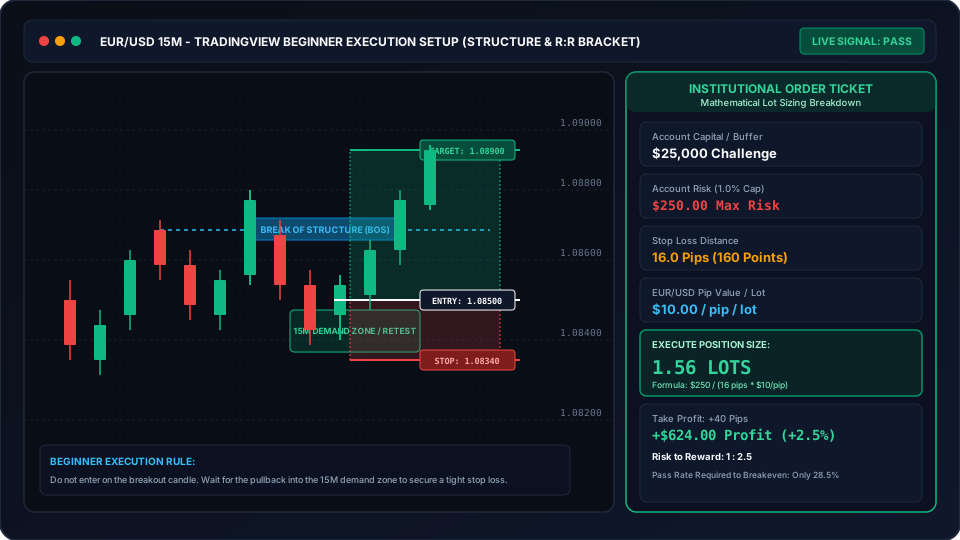
1. Market Structure: The Natural Rhythm of Price
Financial charts move in waves consisting of impulse legs (aggressive institutional expansion) and retracement legs (healthy liquidity pullbacks). Market trend direction is determined by structural swing points:
- Uptrend (Bullish Structure): Price creates a sequence of Higher Highs (HH) and Higher Lows (HL). Beginners should only search for long (buy) setups when market structure is printing higher lows.
- Downtrend (Bearish Structure): Price prints Lower Lows (LL) and Lower Highs (LH). Beginners should focus exclusively on short (sell) setups.
- Break of Structure (BOS): When price decisively closes beyond the most recent swing high or swing low, confirming that institutional momentum is continuing in the trend direction. Review real chart breakdowns in our guide on break of structure examples.
2. The 3 Major Trading Sessions: When to Trade and When to Step Away
The foreign exchange market operates 24 hours a day, five days a week, but liquidity and volatility are concentrated into three primary geographical sessions:
- The Asian Session (Tokyo / Sydney - 00:00 to 07:00 UTC): Characterized by lower trading volume and tight trading ranges. While suitable for mean-reversion scalping on JPY and AUD pairs, breakouts during Asia often suffer high false-positive rates.
- The London Session (07:00 to 12:00 UTC): The primary liquidity engine of the global currency market. European banking institutions establish the daily directional trend, producing aggressive expansions on GBP and EUR pairs.
- The London & New York Overlap (12:00 to 16:00 UTC): The highest-volume 4-hour window of the day. Accounting for over 65% of daily FX volume, this window offers the tightest spreads and cleanest trending follow-through.
To master intraday timing and avoid getting caught in low-liquidity spreads, review our institutional research on the best time to trade forex and our complete guide to gold trading hours.
Module 4: Risk Management Rules You Cannot Break
The difference between a hobbyist who loses money and a professional trader who extracts sustainable withdrawals is risk control. You can have a 40% win-rate strategy and generate handsome monthly profits if your risk-to-reward ratio is mathematically asymmetric.
1. The Non-Negotiable 1% Capital Preservation Rule
Under institutional risk rules, you must never risk more than 1.0% of your current account balance on any single trade idea.
Consider the mathematics of consecutive losing streaks:
- If you risk 10% per trade, a normal statistical streak of 5 consecutive losses destroys 41% of your account balance. To recover back to breakeven, you must generate a +69% return on your remaining capital.
- If you risk 1% per trade, 5 consecutive losses reduces your equity by only 4.9%. A single disciplined winning trade restores your account to full health.
To understand why emotional distress triggers account blowouts, explore our deep research analysis on is day trading hard.
2. The Power of Asymmetric 1:2+ Risk-to-Reward
Never enter a trade where your potential profit target is smaller than your stop loss. Professional trading systems require a minimum 1:2 Risk-to-Reward (R:R) ratio:
Risk: $100 (15 Pips Stop Loss)
Reward: $200+ (30+ Pips Take Profit)
At a 1:2 Risk-to-Reward ratio, you only need to win 34% of your trades to break even. If you win just 45 out of 100 trades, your net P&L is:
- 55 Losses at -$100 = -$5,500
- 45 Wins at +$200 = +$9,000
- Net Realized Profit = +$3,500
You can be wrong more than half the time and still outperform professional fund benchmarks. To model your statistical pass probability across varying win rates, run your parameters through our prop firm pass probability calculator.
Module 5: From Demo to Funded Trader: The Modern Capital Fast-Track
Traditionally, an aspiring trader needed $20,000 to $50,000 in personal savings to generate meaningful monthly income without taking reckless risk. In 2026, the proprietary trading firm model has rendered personal savings trading largely obsolete for beginners.
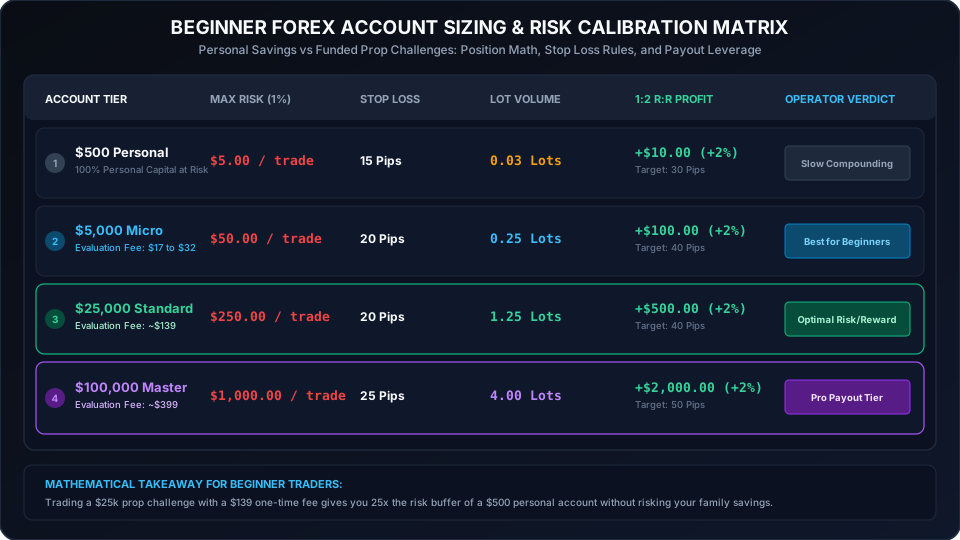
1. The Personal Capital Trap vs The Prop Firm Bridge
Consider the economic comparison between trading your own $500 savings versus purchasing a funded trader evaluation:
- Scenario A: Trading $500 Personal Savings:
To earn $1,000 per month, you must generate a +200% monthly return. Forcing a +200% return requires overleveraging standard lots, taking 20% risk per position, and inevitably suffering catastrophic account liquidation.
- Scenario B: Trading a $50,000 Funded Prop Account:
A $50,000 evaluation challenge costs between $200 and $250. To earn $1,000 per month, you only need a modest 2.5% account gain at an 80% payout split ($1,250 profit * 80% = $1,000 payout). A 2.5% monthly return can be achieved with conservative 0.5% risk per trade and zero emotional strain.
If the trade setup breaches, your maximum loss in Scenario B is strictly capped at the one-time evaluation fee, leaving your personal emergency savings completely protected. To explore how evaluation accounts function, review our breakdown on what is a funding account and compare entry tiers in our review of cheapest prop firm challenges.
The 10-Point Beginner Pre-Execution Checklist
Before executing any market or limit order on a live or evaluation account, verify each of these 10 risk and technical criteria:
- Higher-Timeframe Trend Alignment: Confirm daily and 4-hour market structure matches your trade direction.
- Economic Calendar News Clearance: Verify zero high-impact CPI, NFP, or FOMC releases within 15 minutes of execution.
- Session Liquidity Window: Ensure entry falls strictly within London (07:00 to 12:00 UTC) or NY overlap (12:00 to 16:00 UTC).
- Structural Invalidation Level: Mark a logical swing high or swing low stop loss before calculating entry.
- Exact 1.0% Position Risk Calibration: Calculate lot size dynamically with our free lot size calculator.
- Minimum 1:2.0 Risk-to-Reward Ratio: Ensure the take-profit target offers at least double your stop loss distance.
- Daily Drawdown Floor Verification: Ensure your equity is safely above the 5.0% maximum daily drawdown ceiling.
- Consistency Cap Protection: Verify that projected profits do not breach the 40% single-day profit cap via our consistency rule calculator.
- Midnight Server Rollover Check: Avoid holding intraday scalps through 5:00 PM EST spread blowouts using the reset clock tracker.
- Pre-Trade Journal Entry: Record trade setup, technical catalyst, and emotional state before triggering the buy or sell order.
Printable Forex Beginner Quick Reference Guide & PDF Download Protocol
For traders who prefer a physical desktop cheat sheet or wish to save this handbook as a local PDF document, the reference matrix below summarizes the operational formulas and risk invariants:
| Metric / Parameter | Institutional Rule | Formula / Calculation | Beginner Target Benchmark |
|---|---|---|---|
| Max Risk Per Trade | The 1.0% Rule | Account Balance * 0.01 | Maximum $100 on a $10,000 account |
| Minimum Risk:Reward | Asymmetric Expectancy | Target Pips / Stop Loss Pips | Minimum 1:2.0 (Prefer 1:2.5+) |
| EUR/USD Pip Value | Standard Lot Multiplier | 100,000 Units * 0.0001 | Exactly $10.00 / pip per 1.00 lot |
| Dynamic Lot Sizing | Exact Formula | Dollar Risk / (SL Pips * Pip Value) | Calculated dynamically before order |
| Maximum Daily Drawdown | Prop Firm Safety Floor | Account Starting Equity * 0.05 | Halt all trading at -4.0% to prevent breach |
| Session Focus | Liquidity Killzone | London Open & NY Overlap | 12:00 to 16:00 UTC (8:00 AM to 12:00 PM EST) |
| Journaling Requirement | Statistical Discipline | Document entry, exit, R:R, and emotion | Maintain in free trade journal |
How to Save This Handbook as a Clean PDF:
- In your desktop browser (Chrome, Edge, Safari), press Ctrl + P (or Cmd + P on Mac).
- Select "Save as PDF" from the Printer dropdown menu.
- Under More Settings, ensure "Background Graphics" is checked to preserve vector chart formatting.
- Save the compiled PDF to your local drive for offline daily reference.
Diagnostic & Financial Modeling Suite for Beginner Traders
Before placing orders with live capital or purchasing prop firm challenges, test your trading strategy and risk models with our free suite of browser calculators:
- Position Risk Calibration: Calculate exact lot sizing based on your stop-loss distance with the Prop Firm Lot Size & Pip Calculator.
- Consistency Rule Protection: Test single-day profit caps and simulate daily distribution compliance with the Prop Firm Consistency Calculator.
- Evaluation Pass Simulation: Benchmark your win rate against Monte Carlo drawdown distributions using the Pass Probability Simulator.
- Personal vs Funded Growth Modeling: Compare 12-month capital growth between personal savings and evaluation accounts via the Compounding Simulator.
- Drawdown Buffer Auditing: Audit your daily and maximum drawdown loss buffers with the Drawdown Calculator.
- Session Reset Clocks: Monitor server midnight reset times to prevent overnight rollover spread liquidations with the Reset Clock Tracker.
- Complete Suite: Explore all 13 interactive engineering engines in our Prop Firm Tools Directory.
The Prop Firm Operator Architecture Behind Beginner Accounts
Aspiring proprietary firm founders frequently ask how modern platforms support thousands of beginner retail traders while maintaining firm solvency.
When you start your own prop firm with LaunchPropFirm turnkey software, the platform automates every phase of the beginner trader journey:
- Automated Challenge Blueprints: The admin panel lets operators launch 1-step, 2-step, or instant funding challenges with customizable drawdown rules (static vs trailing) and daily loss caps.
- Instant MT5 & cTrader Bridge Connectivity: Automated server bridges sync execution directly with TradingView browser charts and institutional price feeds.
- Automated Risk Sentinels: The engine monitors trader drawdown floors down to the millisecond, automatically detecting revenge trading, news violations, and unauthorized latency bots.
- Zero-Monthly-Fee Architecture: Unlike legacy SaaS vendors that charge $35,000 to $72,000 annually in monthly software rent, LaunchPropFirm delivers 100% self-hosted ownership from $2,495 one-time, preserving your working capital for trader payout reserves. Model your 12-month balance sheet with our free 7-Sheet Prop Firm Financial Model Workbook or calculate your cost savings on our SaaS vs Self-Hosted Calculator.
Frequently Asked Questions About Forex Trading for Beginners
Can I really learn forex trading for free without paying for courses?
Yes. Every core skill required to achieve consistent trading performance (currency mechanics, market structure, pip mathematics, risk management, and order execution) is freely available in institutional guides like this handbook. Paid trading "gurus" frequently charge thousands of dollars for basic technical indicators. Master the math, practice in a simulated demo environment, and journal 100 trades before spending money on any educational service.
How much money do I need to start trading forex as a beginner?
You do not need thousands of dollars. You should begin by opening a free demo account on MT5 or TradingView to practice position sizing and market structure. Once you achieve consistent profitability over 100 simulated trades, you can purchase a micro funded account challenge ($5,000 to $10,000) for between $17 and $65, giving you professional capital leverage without risking personal savings.
What is the single best currency pair for beginners to trade?
The single best currency pair for beginners is EUR/USD. As the most heavily traded financial asset in the world, EUR/USD offers the tightest broker spreads (often 0.0 to 0.5 pips), high institutional liquidity, and clean technical market structure that respects support, resistance, and session volume without erratic spread spikes.
What is the difference between a pip and a point in forex?
In standard currency pairs, a pip is measured at the fourth decimal place (0.0001). A point (or pipette) represents the fifth decimal place (0.00001). There are 10 points in 1 pip. If a broker quotes a spread of 15 points, that equals 1.5 pips.
How long should I practice on a demo account before risking money?
You should practice on a simulated demo account until you have executed at least 100 consecutive trades adhering strictly to your 1% risk management rules, achieving a positive profit factor (above 1.5) and a verified drawdown below 5%. For most beginners practicing during the London or New York sessions, this requires 2 to 3 months of consistent execution.
How do I use LaunchPropFirm's free calculators with this guide?
Open the Prop Firm Lot Size Calculator alongside your TradingView price chart. When you identify a trade setup, measure the distance between your entry price and stop loss in pips. Enter your account balance and desired risk percentage into the calculator, and execute the exact lot size generated to guarantee you never violate your risk limits.
Evaluate Your Prop Firm Readiness Score (0-100)
Answer 5 quick operational questions about your acquisition channels, runway, and engine tech to get a personalized launch roadmap.

M.Haris
Founder & Platform ArchitectBuilding open prop trading software infrastructure for operators worldwide
I built LaunchPropFirm to give forex educators, trading communities, and fintech operators complete ownership of their platform with full source code and zero monthly SaaS rent. Every article on this blog is drawn from hands-on platform development, live MT5 risk bridge mechanics, and real operator economics.
All content, financial models, ROI estimates, and architecture guides on LaunchPropFirm are published strictly for educational and informational purposes. LaunchPropFirm provides institutional prop trading software and technology infrastructure; it does not operate as a broker, custodian, or registered investment advisor.
Evaluation challenges and funded trader accounts referenced in this guide operate in simulated demo trading environments using real-time market data feeds. Simulated trading results do not represent actual trading performance or financial advice.
Recommended Next Reads
Hand-picked operator guides to scale your prop trading platform.
High Leverage Forex Brokers (2026 Risk & Comparison Matrix)
Compare high leverage forex brokers in 2026. Review 1:500 vs 1:30 limits, offshore B-book margin risks, spread traps, and funded account alternatives.
Forex Lot Size Chart: Pip Calculator & Risk Guide 2026
Master forex lot sizes in 2026. Explore micro, mini, and standard lots, calculate exact pip values, manage spread risks, and use our free lot size tool.
Skip the monthly fees
Own your prop firm platform outright. One time purchase.
Full source code. Live in 7 days. No revenue share. No monthly SaaS bill. See the exact platform before paying anything.
Demo login: haris / asdf1122. No signup needed