Gold Trading Hours: Best Times to Trade XAU/USD in 2026
Discover the best gold trading hours in 2026. Explore London and New York overlaps, hourly XAU/USD volatility, spread traps, and killer execution setups.
Gold (XAU/USD) is the undisputed king of day trading instruments. In proprietary trading evaluations and retail forex brokerages alike, more volume, more volatility, and more blown challenge accounts cluster around spot gold than almost any other asset class. A single macroeconomic headline can displace bullion price by $25 to $40 per ounce in under ten minutes, delivering extraordinary multi-R windfalls to disciplined operators or instantaneous account liquidation to traders caught on the wrong side of the book.
Yet ask the typical day trader what determines whether their gold setup yields profit or catastrophic drawdown, and they will invariably cite candlestick patterns, Fibonacci retracements, or indicator crossovers. Professional institutional bullion desks operate on a fundamentally different premise: entry precision without session timing is financial suicide.
The global gold market does not maintain consistent liquidity across its 24-hour cycle. Understanding the exact gold trading hours, session volume distributions, hourly dollar volatility ranges, and the lethal 5:00 PM EST daily CME settlement break is the essential foundation for passing prop firm evaluations and sustaining six-figure capital allocations.
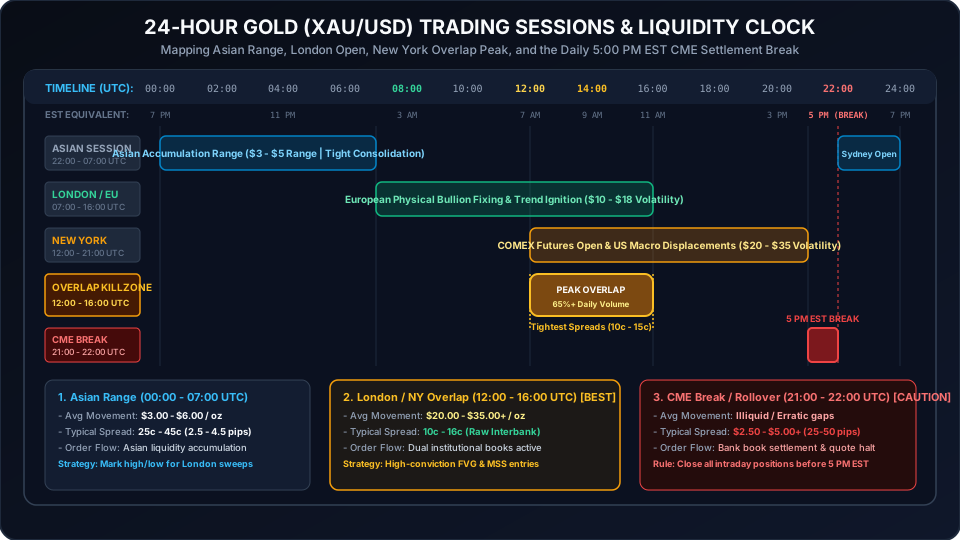
The 24-Hour Gold Market Architecture: Decentralized OTC and COMEX Settlement
Unlike domestic equities that trade on centralized exchanges during fixed banking hours, spot gold is a hybrid market operating around the clock from Sunday 5:00 PM Eastern Standard Time (EST) to Friday 5:00 PM EST.
However, calling gold a "24-hour continuous market" is an oversimplification that traps thousands of retail traders every month. Institutional bullion trading is bifurcated into two dominant clearing mechanisms that dictate liquidity:
Physical OTC Spot (LBMA) vs COMEX Futures
- London Physical Spot Clearing (LBMA): Physical gold settlement is coordinated through the London Bullion Market Association (LBMA), which oversees electronic over-the-counter (OTC) clearing between Tier-1 bullion banks (such as JPMorgan, HSBC, UBS, and Citigroup). The London morning fix (10:30 AM London / 09:30 UTC) and afternoon fix (3:00 PM London / 14:00 UTC) anchor global physical benchmarks.
- New York Futures Clearing (COMEX / CME Group): The Chicago Mercantile Exchange (CME) COMEX division clears the vast majority of gold paper derivative contracts. The opening of COMEX futures pit trading at 8:20 AM EST (13:20 UTC) injects tremendous speculative volume and institutional algorithmic hedging into spot XAU/USD price feeds.
When European and North American trading floors are open simultaneously, the synergy between LBMA OTC spot liquidity and COMEX futures arbitrage creates razor-thin spreads (10¢ to 15¢) and silky price displacement. When both desks are offline, global liquidity drops by over 80%.
The 5:00 PM EST CME Maintenance Break
Every single trading day between 5:00 PM EST and 6:00 PM EST (21:00 to 22:00 UTC), CME Globex halts gold futures trading for its mandatory daily maintenance and settlement window.
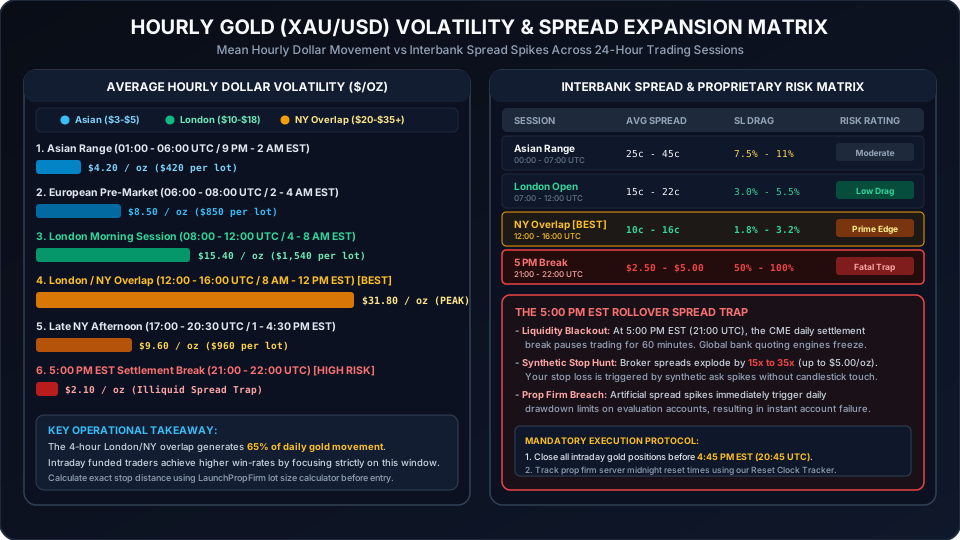
During this 60-minute window, interbank spot liquidity providers pull active bids and asks to reconcile daily balances and calculate financing swap charges. Spreads on XAU/USD routinely explode from a normal 15 cents up to $3.50 or $5.00 per ounce. Holding open day trades into this settlement window is the single most common cause of artificial trailing drawdown violations on prop firm evaluation accounts.
The 4 Global Gold Market Sessions: Hours, Volatility & Strategy Breakdown
To build a reliable trading routine, traders must align their execution with the four distinct phases of the global gold cycle. The comparison table below outlines the operational schedule, average hourly dollar movement, typical interbank spreads, and strategic institutional characteristics for each window:
| Global Trading Session | UTC Active Hours | EST Active Hours | Mean Hourly Dollar Move ($/oz) | Typical Interbank Spread | Primary Institutional Catalyst |
|---|---|---|---|---|---|
| Sydney & Asian Range | 22:00 to 07:00 UTC | 5:00 PM to 2:00 AM EST | $3.00 to $6.00 | 25¢ to 45¢ (2.5 to 4.5 pips) | Asian retail & physical accumulation |
| London Morning Session | 07:00 to 12:00 UTC | 3:00 AM to 8:00 AM EST | $10.00 to $18.00 | 15¢ to 22¢ (1.5 to 2.2 pips) | LBMA physical fix & European trend ignition |
| London / New York Overlap | 12:00 to 16:00 UTC | 8:00 AM to 12:00 PM EST | $20.00 to $35.00+ | 10¢ to 16¢ (Raw Interbank) | COMEX open, US macro data releases & peak volume |
| Late New York Afternoon | 16:00 to 21:00 UTC | 12:00 PM to 5:00 PM EST | $8.00 to $14.00 | 20¢ to 30¢ (2.0 to 3.0 pips) | Wall Street afternoon fixes & book squaring |
| CME Rollover & Settlement Break | 21:00 to 22:00 UTC | 5:00 PM to 6:00 PM EST | Illiquid Chop / Spread Spike | $2.50 to $5.00+ (25 to 50 pips) | Interbank settlement blackout & quote suspension |
1. Asian Session (00:00 to 07:00 UTC): Liquidity Accumulation and False Breakouts
The Asian trading window, centered across Tokyo, Shanghai, Hong Kong, and Singapore, typically produces low directional momentum. While China and India represent the world's largest physical consumers of gold bullion, physical retail import flows do not translate into high-speed speculative price velocity on Western broker charts.
During the Asian session, gold routinely oscillates within a narrow $3.00 to $6.00 range. Smart money algorithms treat this tight accumulation band as liquidity generation. Retail day traders who attempt breakout strategies during Asian hours frequently suffer double stop-outs: the price wicks above the range high by 80 cents, triggers breakout buy orders, reverses abruptly to sweep the range low, and returns to the midpoint.
Execution Protocol: Treat the Asian high and Asian low as key reference benchmarks. Mark these horizontal levels on your 15-minute chart and wait for London market makers to sweep them before looking for high-probability reversals.
2. London Morning Session (07:00 to 12:00 UTC): LBMA Fix and Trend Ignition
When European financial centers open at 07:00 UTC (3:00 AM EST), institutional money enters the market with substantial velocity. The City of London serves as the historical home of global precious metals price discovery.
Between 07:00 UTC and 09:30 UTC, European bullion desks frequently execute the initial "Judas Swing": an aggressive push that sweeps resting buy stops or sell stops accumulated during the overnight Asian range. Once this liquidity is absorbed, gold establishes its primary morning trend. Hourly price displacement jumps to $10.00 to $18.00, providing clean fair value gap retests and market structure shifts that offer high reward-to-risk ratios.
3. The London and New York Overlap (12:00 to 16:00 UTC): The 65% Volume Killzone
Just as major currency pairs experience peak liquidity during European and American market intersections (as detailed in our guide on the best time to trade forex), the 4-hour window from 12:00 UTC to 16:00 UTC (8:00 AM to 12:00 PM EST) is universally recognized as the best time to trade gold in forex.
During this overlap, the world's two largest financial liquidity engines operate simultaneously:
- Maximum Liquidity Concentration: More than 65% of total daily global gold transaction volume is processed within these four hours.
- Tightest Execution Spreads: Interbank spreads compress to their absolute daily minimum (frequently 10 to 14 cents on raw institutional ECN feeds).
- Macro Catalyst Fuel: Tier-1 US economic reports (Non-Farm Payrolls, CPI inflation, PPI, Retail Sales, and FOMC policy statements) are published between 8:30 AM and 2:00 PM EST, generating clean, explosive institutional expansions of $25 to $40 per ounce.
- Sub-10ms Order Routing: High liquidity depth ensures that market orders execute with near-zero slippage on modern trading bridges.
For day traders navigating evaluation rules, concentrating all trading activity inside this 4-hour golden window dramatically enhances win-rates while minimizing exposure to low-volume market noise.
4. Late US Session & Institutional Cooldown (16:00 to 21:00 UTC)
Following the London market close at 16:00 UTC (12:00 PM EST), European desks square their daily balance sheets and hand off order flow exclusively to New York. Volatility gradually diminishes from $30+ down to $8 to $14 per hour.
While afternoon news events such as 2:00 PM EST Federal Reserve FOMC minutes can trigger sharp spikes, price action between 2:30 PM EST and 4:45 PM EST generally drifts into low-momentum retracements. Disciplined traders conclude their intraday operations by 4:00 PM EST to avoid being caught in late-session chop.
Hourly Gold Volatility vs Spread Expansion: Analyzing the Slippage Matrix
To protect your funded account balance, observing price action on a clean candlestick chart is not enough. You must understand the direct relationship between hourly price displacement and broker spread drag.
Contract Sizing and Pip Valuation on XAU/USD
While currency traders can reference standardized pip values across major pairs using our institutional forex lot size chart, gold (XAU/USD) is priced in US Dollars per troy ounce, creating a unique valuation structure that catches inexperienced traders off guard:
- 1 Standard Lot = 100 Troy Ounces of Gold
- $0.01 Price Movement (1 Cent Pip) = $1.00 USD PnL
- $0.10 Price Movement (1 Point) = $10.00 USD PnL
- $1.00 Price Movement ($1.00/oz Price Change) = $100.00 USD PnL
- $10.00 Price Movement (Typical 1-Hour Overlap Range) = $1,000.00 USD PnL
The table below outlines contract sizing, pip values, and maximum position sizes to maintain a strict 0.50% risk cap on a $100,000 evaluation account:
| Contract Sizing Tier | Contract Units (Troy Oz) | Dollar Value per $0.01 Pip | Dollar Value per $0.10 Point | Dollar Value per $1.00 Move | 0.5% Risk Sizing on $100k Account ($500 Risk / $6.00 SL) |
|---|---|---|---|---|---|
| Standard Lot (1.00) | 100 Troy Oz | $1.00 USD | $10.00 USD | $100.00 USD | 0.83 Lots ($498 Max Risk) |
| Mini Lot (0.10) | 10 Troy Oz | $0.10 USD | $1.00 USD | $10.00 USD | 8.33 Mini Lots ($498 Max Risk) |
| Micro Lot (0.01) | 1 Troy Oz | $0.01 USD | $0.10 USD | $1.00 USD | 83 Micro Lots ($498 Max Risk) |
Why Fixed Lot Sizing Destroys Gold Accounts
Because a $1.00 price swing on a standard lot equals $100.00, executing fixed lot sizes without measuring your structural stop loss distance is fatal. If a trader opens 2.00 lots on XAU/USD with a $4.00 stop loss, they risk $800.00. But if high volatility during a US CPI release requires an $8.00 stop loss, that exact same 2.00 lot position exposes $1,600.00: instantly risking more than 30% of their total daily drawdown allowance.
To calculate exact mathematical contract sizes tailored to your stop loss and account balance, utilize our free prop firm lot size calculator before opening any precious metals trade.
Skip the monthly fees
Own your prop firm platform outright. One time purchase.
Full source code. Live in 7 days. No revenue share. No monthly SaaS bill. See the exact platform before paying anything.
Demo login: haris / asdf1122. No signup needed
The 5:00 PM EST Rollover Spread Trap: How Midnight Spikes Wreck Funded Accounts
The most dangerous pitfall in precious metals trading is the gold rollover spread trap. Every business day at precisely 5:00 PM Eastern Standard Time (21:00 UTC), global banking centers perform value-date reconciliations.
Synthetic Bid-Ask Widening Explained
When the 60-minute CME maintenance break begins at 5:00 PM EST, institutional market makers withdraw their liquidity books. Retail broker price engines lose their underlying futures feed and immediately inflate the bid-ask spread to hedge against directional gap risk.
A normal raw spread of 12¢ ($0.12) can explode to $3.50, $4.80, or even $6.00 per ounce between 4:55 PM EST and 5:30 PM EST:
Spread Drag Ratio on Gold = $4.00 Spread Spike ÷ $6.00 Stop Loss = 66.6% Capital Consumption
If a trader is holding an open long position with a protective stop loss positioned $3.00 below current market price, the artificial widening of the ask/bid quote triggers the stop loss immediately, even though the physical candlestick price never traded down to the trader's invalidation point.
Mitigating Midnight Equity Floor Breaches
In proprietary trading, daily drawdown limits are calculated based on either daily starting equity or balance at server midnight reset. When an overnight spread spike artificially depresses your account's floating equity by hundreds of dollars, automated risk engines record an immediate drawdown breach, terminating your funded account before the Asian session even opens.
To protect your capital:
- Enforce Hard Intraday Flat Rules: Liquidate all open XAU/USD positions by 4:45 PM EST (20:45 UTC) at the latest.
- Monitor Server Midnight Reset Times: Different prop firms anchor their daily reset clocks to different time zones (e.g., midnight GMT, midnight UTC, or 5:00 PM EST). Use our free prop firm reset clock tracker to synchronize your trading schedule with your firm's specific server clock.
- Simulate Worst-Case Spreads: Verify that your floating margin maintains an adequate buffer using our prop firm drawdown calculator.
Realistic Intraday Trade Execution: XAU/USD 15M Order Ticket Case Study
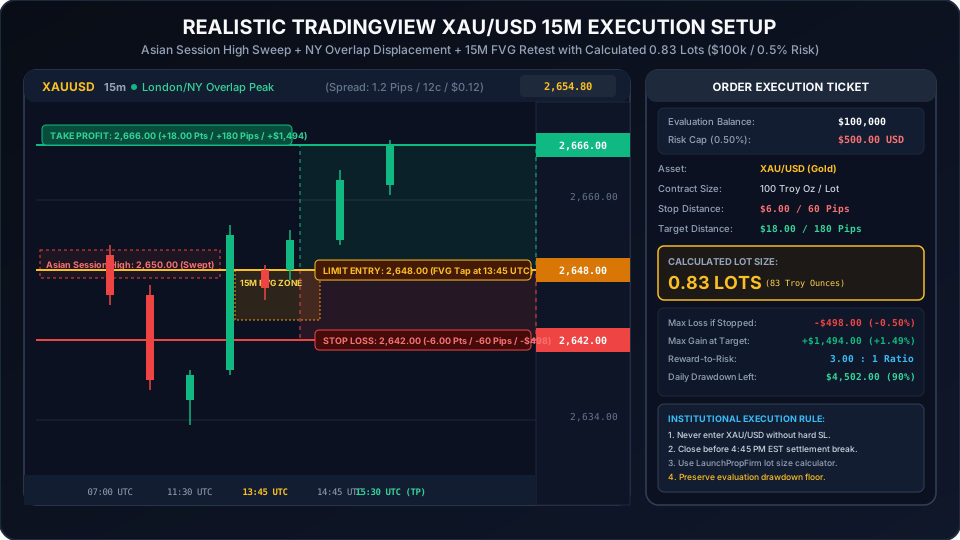
To observe how professional session timing and mathematical lot sizing operate in live market conditions, let us analyze a textbook execution on the XAU/USD 15-minute chart during the London/New York session overlap:
Setup Anatomy: Asian High Sweep & FVG Retest
- Pre-Market Benchmark: During the Asian session, gold established a local ceiling at 2,650.00. Buy stop liquidity accumulated immediately above this psychological boundary.
- London Morning Displacement: At 07:15 UTC, European algorithms engineered an upward wick to 2,651.50, sweeping the Asian high and absorbing retail breakout orders. The market then aggressively displaced downward into the London morning, establishing discount pricing at 2,638.00.
- New York Overlap Market Structure Shift: At 13:30 UTC, the opening of COMEX futures and US macro data releases triggered massive institutional buying. An explosive green displacement candle surged through prior structure, closing decisively above 2,646.00 and confirming a bullish Market Structure Shift (MSS).
- Fair Value Gap Inception: The displacement left a pristine 15-minute Bullish Fair Value Gap (FVG) between 2,646.00 and 2,650.00.
- Execution Order Ticket:
- Order Type: Buy Limit
- Entry Price: 2,648.00 (Midpoint / Consequent Encroachment of 15M FVG)
- Stop Loss: 2,642.00 ($6.00 / 60 Pips below displacement candle low)
- Take Profit Target: 2,666.00 ($18.00 / 180 Pips into resting buy-side liquidity)
- Reward-to-Risk Ratio: 3.00 : 1 Asymmetric Edge
Precision Terminal Calibration on a $100,000 Challenge
On a $100,000 funded evaluation account, the trader strictly limits risk to 0.50% ($500.00 USD):
- Account Balance: $100,000.00 USD
- Allowable Dollar Risk: $500.00 USD
- Stop Loss Distance: $6.00 per ounce
- Risk per Standard Lot (100 oz): $6.00 × 100 = $600.00 USD
- Calculated Volume: $500.00 ÷ $600.00 = 0.83 Standard Lots (83 Troy Ounces)
- Potential Reward: 0.83 lots × $18.00 × 100 = +$1,494.00 USD (+1.49% Account Gain)
- Max Potential Loss: 0.83 lots × $6.00 × 100 = -$498.00 USD (-0.50% Capital Protection)
The trade tapped into the FVG limit order at 13:45 UTC, expanded cleanly throughout the overlap, and reached the 2,666.00 profit target at 15:30 UTC. The trader banked $1,494.00, captured 15% of the total two-phase challenge profit target, and flattened their terminal well before the 5:00 PM EST rollover break.
Compounding Asymmetric Expectancy in Precious Metals Trading
The true advantage of mastering gold trading times and mathematical sizing becomes unmistakable when compounded over quarterly and annual evaluation horizons. As explored in our deep analysis on is day trading hard, amateur traders believe that aggressive 3% to 5% risk per trade is necessary to pass prop firm challenges rapidly.
In reality, extreme leverage on volatile commodities like gold guarantees account failure during standard losing streaks. Professional operators rely on low fixed-percentage risk (0.50% or 0.25%) paired with asymmetric 3:1 reward-to-risk executions:
Consider the mathematical divergence across twenty trades:
- The Gambler (Risks 3% per trade on Gold): Experiencing three consecutive losses during choppy Asian sessions burns 9% of equity, triggering an immediate maximum trailing drawdown violation and forfeiture of the account.
- The System Operator (Risks 0.5% per trade during NY Overlap): Three consecutive losses consume just 1.5% of equity. A single subsequent 1:3 R:R winning execution (+1.50% net profit) erases the entire drawdown deficit, keeping the evaluation fully intact.
Traders can model projected multi-account scaling and payout timelines using our prop firm calculator or explore our complete catalog of quantitative resources in the LaunchPropFirm trading tools directory.
The Prop Firm Operator Perspective: How Bridge Risk Engines Monitor Gold Exposure
For entrepreneurs and prop firm founders building platforms via LaunchPropFirm's turn-key infrastructure, understanding gold trading mechanics is critical for protecting company liquidity pools and balance sheets.
Modern institutional trading bridges (connecting MetaTrader 5, cTrader, and DXtrade to liquidity providers) deploy automated AI Sentinel engines to monitor precious metals order books for toxic retail flow:
Automated Pre-News Leverage Restrictions
Precious metals exhibit violent tick slippage during US economic data releases. If hundreds of retail evaluation accounts execute maximum-leverage 20-lot gold orders thirty seconds before an NFP release, liquidity providers can fill those orders with $1.50 to $3.00 of negative slippage.
Turnkey prop firm risk engines automatically enforce pre-news buffer zones, capping maximum allowable leverage or pausing order execution for two minutes around tier-1 events. Review our comprehensive guide on prop firm news trading rules to inspect how modern firms configure these safeguards.
Combating Rollover Latency Arbitrage
Predatory algorithmic traders frequently attempt latency arbitrage during the 5:00 PM EST CME settlement break. When quoting engines experience intermittent freeze states, arbitrage bots attempt to execute synthetic buy or sell orders at stale pre-break prices, exploiting the broker's execution delay.
Prop firm operators protect their platforms by integrating automated spread filters:
- Dynamic Spread Caps: When the XAU/USD spread exceeds $1.00/oz, the bridge automatically halts new order submissions, protecting honest traders from slippage while preventing latency exploitation.
- Midnight Rollover Freezes: Automated server policies prevent opening new market orders between 4:55 PM EST and 5:15 PM EST.
- Drawdown Floor Auditing: Server engines monitor trailing high-water marks down to the millisecond, as detailed in our guide on prop firm drawdown explained.
By deploying these institutional risk controls, proprietary trading firms maintain fair, transparent, and solvent evaluation ecosystems for genuine market participants.
Frequently Asked Questions About Gold Trading Hours and XAU/USD Sessions
What are the best hours to trade gold (XAU/USD) in forex?
The single best time to trade gold is during the London and New York session overlap from 12:00 UTC to 16:00 UTC (8:00 AM to 12:00 PM EST). This 4-hour window accounts for more than 65% of total daily gold volume, provides the tightest interbank spreads (10¢ to 16¢), and delivers reliable directional expansions of $20 to $35 per ounce.
Does gold trade 24 hours a day continuously?
Gold trades 24 hours a day from Sunday 5:00 PM EST to Friday 5:00 PM EST, but it is not continuous. Every business day between 5:00 PM EST and 6:00 PM EST (21:00 to 22:00 UTC), the Chicago Mercantile Exchange (CME) halts electronic futures trading for daily maintenance and settlement. During this 60-minute break, liquidity evaporates and broker spreads spike dramatically.
Why do gold spreads widen so drastically at 5:00 PM EST?
Spreads widen at 5:00 PM EST because the CME futures market closes for settlement and Tier-1 interbank bullion banks temporarily pull their resting quotes to reconcile daily balances and calculate financing swap charges. Without deep underlying liquidity, retail brokers expand their bid-ask spreads by 15x to 35x to protect against inventory gap risk.
How is a pip calculated in gold trading compared to forex?
In forex currency pairs, one pip typically represents the fourth decimal digit (0.0001). In gold (XAU/USD), 1 pip equals $0.01 (one cent) of price movement, while 1 point equals $0.10 (ten cents). On a standard 1.00 lot contract (100 troy ounces), each $0.01 cent move equals $1.00 USD, each $0.10 point equals $10.00 USD, and each $1.00 change in the price of gold equals exactly $100.00 USD.
How does LaunchPropFirm's reset clock tracker help gold traders?
LaunchPropFirm's free prop firm reset clock tracker helps gold traders by displaying real-time countdown clocks to daily midnight server resets and the 5:00 PM EST settlement break across all major prop firms. This ensures traders can close open positions before spreads blow out, protecting funded accounts from artificial trailing drawdown liquidations.
Evaluate Your Prop Firm Readiness Score (0-100)
Answer 5 quick operational questions about your acquisition channels, runway, and engine tech to get a personalized launch roadmap.

M.Haris
Founder & Platform ArchitectBuilding open prop trading software infrastructure for operators worldwide
I built LaunchPropFirm to give forex educators, trading communities, and fintech operators complete ownership of their platform with full source code and zero monthly SaaS rent. Every article on this blog is drawn from hands-on platform development, live MT5 risk bridge mechanics, and real operator economics.
All content, financial models, ROI estimates, and architecture guides on LaunchPropFirm are published strictly for educational and informational purposes. LaunchPropFirm provides institutional prop trading software and technology infrastructure; it does not operate as a broker, custodian, or registered investment advisor.
Evaluation challenges and funded trader accounts referenced in this guide operate in simulated demo trading environments using real-time market data feeds. Simulated trading results do not represent actual trading performance or financial advice.
Recommended Next Reads
Hand-picked operator guides to scale your prop trading platform.
Forex Lot Size Chart: Pip Calculator & Risk Guide 2026
Master forex lot sizes in 2026. Explore micro, mini, and standard lots, calculate exact pip values, manage spread risks, and use our free lot size tool.
How to Learn How to Day Trade: 2026 Step-by-Step Blueprint
Master day trading in 2026 with a proven 5-stage roadmap. Learn market mechanics, 1% risk rules, demo forward-testing, and funded challenge protocols.
Skip the monthly fees
Own your prop firm platform outright. One time purchase.
Full source code. Live in 7 days. No revenue share. No monthly SaaS bill. See the exact platform before paying anything.
Demo login: haris / asdf1122. No signup needed