When Does a Bearish Market Become Bullish in Forex? (2026)
Learn when a bearish market becomes bullish in forex. Master lower high breaks, CHoCH vs MSS rules, wick sweep traps, and high-R:R trend reversal setups.
Every day in the foreign exchange currency markets, thousands of ambitious retail traders lose their evaluation accounts attempting to do the single most dangerous thing in trading: trying to catch the exact bottom of a falling market.
They watch EUR/USD or GBP/USD drop 150 pips, open their terminal, convince themselves that price has "fallen too far," and click BUY without structural confirmation. Moments later, institutional algorithmic sell programs sweep sell-side liquidity, drive price down another 40 pips, and trigger an automated daily drawdown breach on their prop firm account.
In institutional price action trading, a downtrend does not end simply because price looks cheap or because an RSI oscillator dips below 30. A bearish market only becomes bullish when a specific, verifiable mechanical sequence occurs: the complete breakdown of sell-side order flow and the structural capture of the last protected lower high with a confirmed candle body close.
In this comprehensive guide, we will unpack the exact anatomy of trend reversals, distinguish between Change of Character (CHoCH) and Market Structure Shift (MSS), expose how smart money traps retail bottom-fishers with wick sweeps, and provide an objective execution playbook to enter reversal expansions with asymmetric risk-to-reward ratios.
The 30-Second Newbie Rule: How to Spot a Real Reversal in 3 Seconds
1. Do not buy just because price looks cheap: A market that dropped 100 pips can easily plunge another 100 pips if institutions are still selling.
2. Locate the Last Protected Lower High (LH): Find the swing peak that directly caused the final lowest drop. That is the sellers' "locked door."
3. Demand a Candle Body Close: A wick poking above the line is a trap. The solid colored body must close completely above the Lower High on your execution timeframe.
4. Never chase the green breakout candle: Wait patiently for price to pull back into the Demand Order Block, place your limit order, and set your stop loss safely below the low.
1. The Expensive Trap: Why Retail Traders Fail Trying to "Catch the Bottom"
The psychological impulse to buy a falling market stems from retail consumer conditioning. In everyday life, purchasing an asset at a discount is considered wise financial management. When high-grade goods go on sale, consumers rush to buy.
In currency markets, however, price does not operate like a retail supermarket:
- A market that is falling aggressively is falling because institutional order flow (central banks, sovereign wealth funds, and tier-1 algorithmic liquidity providers) is dumping inventory and absorbing all available buy liquidity.
- Every retail attempt to buy without structural confirmation provides liquidity for institutional sell limits.
- When thousands of retail traders place speculative buy orders with tight 15-pip stops, they create a dense pool of sell-side liquidity (stop loss orders) directly below swing lows.
- Institutional market makers deliberately drive price deeper to trigger those stop losses, generating the massive liquidity required to fill their institutional orders.
Trying to catch a falling knife without waiting for structural confirmation is the fastest path to account liquidation. Professional prop traders do not care about buying at the absolute lowest pip of the day; they care about buying at the exact price point where institutional buyers have demonstrably seized control of the market.
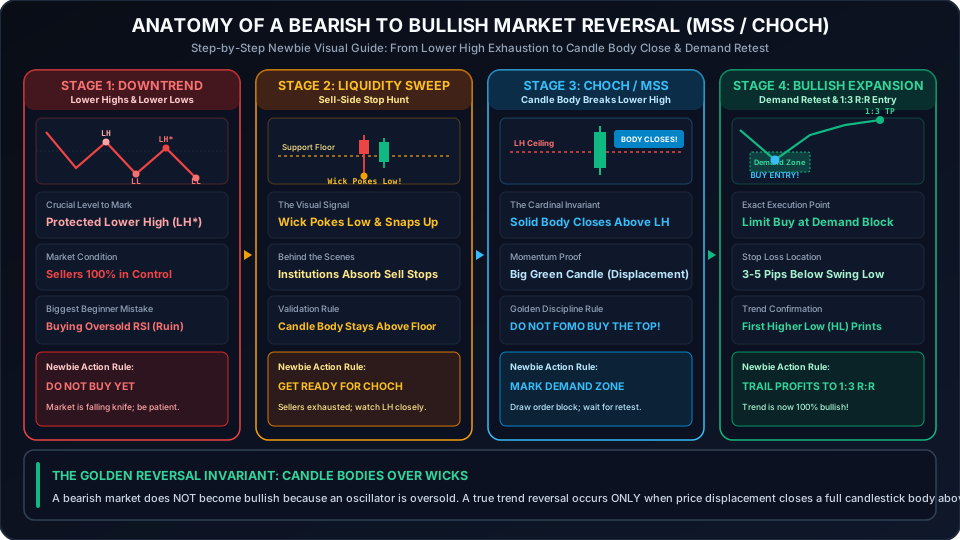
2. The Mechanics of a Bearish Trend: The Protected Lower High Concept
To recognize when a bearish market becomes bullish, you must first master the strict mathematical definition of a bearish trend.
A bearish trend is an uninterrupted sequence of Lower Highs (LH) and Lower Lows (LL):
- Lower Low (LL): Price creates a structural bottom that breaks below the previous swing low.
- Lower High (LH): Sellers allow price to pull back to absorb buy liquidity, but cap the rally below the preceding swing high, before resuming downward expansion.
The Protected Lower High Invariant
Not all swing highs in a downtrend are structurally equal. Understanding the difference between a minor internal high and a protected structural lower high separates amateur chart readers from institutional prop operators:
- A Protected Lower High is the swing high that directly caused the creation of the most recent Lower Low.
- Because institutional sellers committed billions of dollars of capital at that specific level to push price into a fresh low, they actively defend that price zone.
- As long as the market remains below that protected lower high, the bearish market structure remains 100% intact.
- Minor pullbacks, 5-minute green candles, and temporary consolidation patterns below that level represent internal noise, not a trend reversal.
If price rallies 50 pips inside a downtrend but fails to breach the protected lower high, smart money is merely re-pricing the asset into a discount zone before initiating the next wave of institutional selling.
The Locked Door Security Analogy for Beginners
To make this concept unforgettable for beginner traders, imagine a high-security building occupied by sellers:
- Each Lower High is a locked steel security door on a lower floor. Sellers hold the keys and defend the doorway.
- When eager retail buyers attempt a counter-trend rally, they run up the stairs to the door. If price spikes through the door with a thin wick but quickly falls back down, the buyers only rattled the doorknob from the hallway. The door remains locked!
- A bearish trend only turns bullish when buyers kick the door down, cross the threshold, and stand firmly inside the room with both feet planted on the floor. In technical trading, standing with both feet inside the room is a solid candlestick body close.
- If you click BUY when the door is still locked, you are simply donating your trading balance to the sellers.
3. The Exact Structural Turning Point: When Does the Shift Actually Occur?
A bearish market becomes bullish when the market completes a verified 5-stage mechanical sequence. If even one stage is missing, you are looking at a trap rather than a genuine structural reversal:
Stage 1: Sell-Side Liquidity Sweep (The Bottom Sweep)
Before a genuine trend reversal, price almost always sweeps the lowest structural swing low. This move grabs retail stop-loss orders and induces breakout sellers into short positions. Once those sell stops are triggered, institutional buyers absorb the volume.
Stage 2: Aggressive Counter-Trend Displacement
Instead of continuing to grind lower after sweeping liquidity, price violently surges upward. This move is characterized by large, full-bodied bullish candlesticks with minimal wicks, leaving behind Fair Value Gaps (FVGs) and imbalance zones.
Stage 3: Break of the Last Protected Lower High (CHoCH / MSS)
Price expands past the exact price level of the last protected lower high that formed the lowest low. This is the pivotal moment: the structural ceiling that defined the bearish trend has been penetrated.
Stage 4: Candle Body Close Confirmation
The closing price of the candlestick on your operational timeframe closes completely above the protected lower high. A naked wick poke does not qualify. The body close confirms that buyers successfully absorbed all institutional sell orders defending that level.
Stage 5: Formation of the First Higher Low (The Retest)
After confirming the structural break, price pulls back to retest the originating institutional demand block or imbalance zone. Sellers attempt to push price lower but fail to create a new low. Price forms a verified Higher Low (HL) and resumes upward expansion to create a Higher High (HH).
Once Stage 5 completes, the downtrend is officially dead. The market has structurally pivoted from bearish order flow to bullish order flow.
Skip the monthly fees
Own your prop firm platform outright. One time purchase.
Full source code. Live in 7 days. No revenue share. No monthly SaaS bill. See the exact platform before paying anything.
Demo login: haris / asdf1122. No signup needed
4. CHoCH vs MSS vs BOS: Decoding Institutional Terminology
Traders often become confused by smart money concepts (SMC) acronyms. While many YouTube educators use them interchangeably, understanding the precise mechanical difference is essential for disciplined execution:
| Structural Term | Full Name | Market Function | Operational Meaning |
|---|---|---|---|
| BOS | Break of Structure | Trend Continuation | Price breaks a swing point in the direction of the prevailing trend (e.g., breaking a lower low in a downtrend). |
| CHoCH | Change of Character | Early Trend Warning | The first structural violation where price breaks the opposite swing point (breaking the last lower high). |
| MSS | Market Structure Shift | Confirmed Trend Pivot | A decisive displacement across multiple timeframes confirming that institutional flow has reversed. |
The Relationship Between CHoCH and MSS
Think of a Change of Character (CHoCH) as the yellow traffic light: it warns you that the bearish momentum has exhausted and the market character has flipped.
A Market Structure Shift (MSS) is the green traffic light: it represents the full structural confirmation where displacement, candle body close, and imbalance alignment confirm that institutional capital has committed to the bullish direction.
To explore how continuation breaks operate within established trends, study our visual breakdown of break of structure examples.
5. The Candle Body Invariant: Why Wick Spikes Are Traps, Not Reversals
The single most common mistake in trading trend reversals is mistaking a wick spike for a structural break.
Memorize this core institutional rule: Wicks hunt liquidity, but candle bodies tell the story.
The Anatomy of the Wick Rejection Trap
- In an established downtrend, EUR/USD has a protected lower high at 1.08200.
- During high-volatility news (such as US CPI or London open), price rapidly spikes up to 1.08260.
- Retail breakout traders see price trading above 1.08200 and click BUY with market orders.
- Institutional algorithms waiting above 1.08200 utilize this influx of retail buy orders to offload massive short positions.
- Within 5 minutes, price collapses back to 1.08050. The 15-minute candle closes at 1.08080, leaving behind a 20-pip upper wick above 1.08200.
- The retail breakout buyers are now completely trapped in losing long positions, while the bearish trend resumes toward fresh lows.
Non-Negotiable Rule of Confirmation:
If the solid body of the candlestick does not close completely above the horizontal line marking the protected lower high on your execution timeframe (15-minute or 1-hour), the market is NOT bullish. It is a liquidity sweep fakeout. You must never enter a long reversal trade until a candle body closes firmly outside the structure.
6. Step-by-Step Execution Playbook: Entering Reversals at Institutional Demand
Once a valid candle body close confirms that a bearish market has transitioned into a bullish structure, professional traders do not buy the high of the breakout candle. Buying at the peak of displacement exposes you to excessive drawdown when price naturally retraces.
Follow this systematic 4-step execution framework to enter with institutional precision:
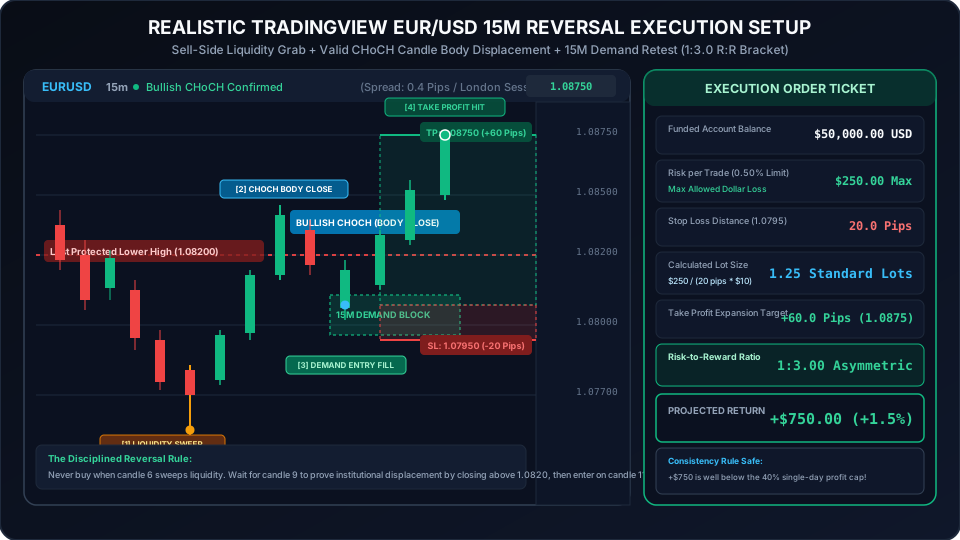
Candle-by-Candle Beginner Walkthrough of the TradingView Setup
Look closely at our 15-minute EUR/USD setup graphic above. Here is the exact story told by each candle from left to right:
- Candles 1 to 5 (The Downtrend Grinds Down): Clean red candlesticks printing consecutive Lower Highs and Lower Lows. Institutional sellers are in complete control of the order flow.
- Candle 6 (The Stop Hunt Trap at 1.07600): A deep downward wick grabs sell-side liquidity below the previous floor, inducing retail breakout sellers into bad short trades while triggering retail stop losses.
- Candles 7 to 8 (The Displacement Surge): Aggressive green candles surge upward, absorbing all available supply and leaving behind Fair Value Gaps.
- Candle 9 (The Magic Moment - CHoCH Confirmed): The candle surges past the 1.08200 Lower High and closes its full body at 1.08350. The downtrend is officially broken!
- Candle 10 (The Healthy Pullback): Instead of FOMO-buying at the top of candle 9, professional prop traders wait patiently as price naturally pulls back into discount territory.
- Candle 11 (The Precision Entry Fill at 1.08150): Price taps directly into the 15-minute Demand Order Block. Your pending limit buy order fills at 1.08150 with a tight 20-pip stop loss at 1.07950.
- Candles 12 to 14 (The Bullish Expansion): The market explodes upward, hitting your Take Profit target at 1.08750 (+60 pips), banking a clean 1:3.0 Risk-to-Reward gain!
Step 1: Identify the Originating Demand Order Block
When price displaces upward to break the protected lower high, look at the base of that impulsive move. Identify the last down-close (bearish) candlestick that occurred immediately before the aggressive bullish expansion. That candlestick represents the Institutional Demand Block (Bullish Order Block).
Step 2: Measure the Optimal Trade Entry (OTE) Zone
Draw a Fibonacci retracement tool from the absolute swing low to the swing high of the displacement leg:
- The premium zone (above 50%) is too expensive to buy.
- The discount zone sits between the 61.8% and 78.6% retracement levels.
- When the Demand Order Block aligns within the 61.8%-78.6% discount zone, you have a high-probability institutional confluence.
Step 3: Place Your Limit Order and Protective Stop Loss
- Entry: Set a pending limit buy order at the proximal edge (top) of the Demand Order Block.
- Stop Loss: Place your protective stop loss strictly 3 to 5 pips below the lowest wick of the swing low.
- If price breaks below that swing low, your reversal thesis is mathematically invalidated, and you exit with a small, calculated loss.
Step 4: Calibrate Position Size to Protect Drawdown
Never risk an arbitrary number of lots. Use our free prop firm lot size calculator to compute your exact lot size based on your stop-loss distance in pips and your allowed account risk (e.g., 0.5% or 1.0%). To determine whether current market conditions offer clean trending volatility, consult our guide to the best time to trade forex.
7. True Reversal vs Liquidity Sweep Fakeout (Comprehensive Comparison Matrix)
Before risking capital on a reversal setup, benchmark the price action against this institutional comparison matrix:
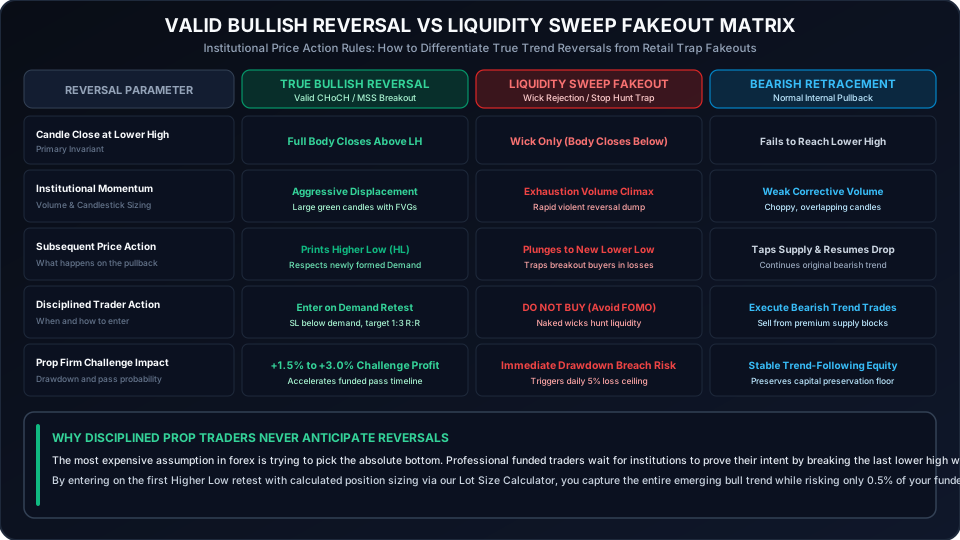
| Technical Feature | Valid Bullish Reversal (CHoCH / MSS) | Bearish Liquidity Sweep Fakeout | Minor Retracement Pullback |
|---|---|---|---|
| Candle Close Location | Body closes above protected Lower High | Wick breaches level; body closes below | Body remains entirely below Lower High |
| Displacement Quality | Energetic green candles with Fair Value Gaps | Fast spike followed by immediate collapse | Sluggish, overlapping candles with low momentum |
| Sell-Side Liquidity | Preceded by clear liquidity grab below swing low | No liquidity sweep; random mid-range spike | Normal corrective zigzag into internal resistance |
| Retest Behavior | Order Block holds firmly; prints Higher Low | Fails to hold demand; aggressively breaches low | Continues downward to print new Lower Low |
| Volume & Flow | Institutional buy volume absorbs all supply | Retail buy stops filled by institutional shorts | Low participation; automated algorithmic drift |
| Trader Action | BUY on limit retest of Demand Block | DO NOT BUY - prepare to sell continuation | SELL at premium bearish supply zone |
| Prop Firm Strategy | High R:R (1:3 to 1:5) asymmetric setup | Avoids catastrophic 5% daily drawdown breach | Disciplined trend continuation execution |
8. Drawdown Management & Asymmetric R:R for Funded Prop Firm Traders
Trading trend reversals offers the highest theoretical Risk-to-Reward (R:R) ratios in financial markets. Because you enter at the very beginning of a new market cycle, your stop loss is tight (10 to 18 pips) while your profit target sits at the major macro swing highs (50 to 100+ pips).
However, in proprietary trading firm evaluations, trading reversals carries a unique hazard: lower win-rate expectancy.
The Mathematics of Reversal Expectancy
- Even high-grade reversal setups rarely achieve win rates higher than 40% to 48%, because markets spend more time continuing trends than reversing them.
- However, when a genuine reversal runs, it delivers 1:3.5 to 1:6.0 Risk-to-Reward.
- Consider the mathematical outcome of 20 reversal trades risking 0.5% ($500 on a $100,000 account) with a 45% win rate and an average 1:3.5 R:R:
- 11 Losing Trades: 11 x -$500 = -$5,500
- 9 Winning Trades: 9 x +$1,750 = +$15,750
- Net Realized Profit: +$10,250 (+10.25%)
With just a 45% win rate, the trader easily passes a 10% Phase 1 prop firm evaluation while never risking more than 0.5% per trade.
To model how asymmetric payoffs compound your account over time, test our interactive simulator:
To test whether your specific strategy win rate and risk-reward profile can safely pass evaluation drawdown rules without blowing up, run your metrics through our pass probability calculator. Furthermore, ensure your daily profits comply with prop firm consistency rules using our consistency rule calculator.
9. Interactive Diagnostic & Position Sizing Tools for Reversal Traders
Precision execution requires institutional tools. Utilize our free engineering engines to eliminate guesswork from your trading:
- Dynamic Position Sizing: Calculate exact contract sizes based on stop-loss pips and dollar risk with our Prop Firm Lot Size & Pip Calculator.
- Personal vs Prop Capital Modeling: Simulate 12-month capital growth between personal high-leverage accounts and funded challenges with the Compounding Simulator.
- Drawdown Buffer Analysis: Model your distance to liquidation across varying lot sizes using the Drawdown Calculator.
- Daily Reset Clock: Track exact daily session rollovers and avoid spread-widening traps at 5:00 PM EST with our Reset Clock Tracker.
- Full Architecture Suite: Explore all 13 interactive engineering engines in our Prop Firm Tools Directory.
10. The Prop Firm Operator Architecture Behind Volatility Reversals
Aspiring prop firm founders frequently ask how proprietary trading platforms manage risk when hundreds of retail traders attempt to trade major reversal events like central bank interest rate decisions or Non-Farm Payrolls (NFP).
In an institutional white-label platform like LaunchPropFirm:
- Automated Risk Engine: The backend server monitors real-time account equity and balance across MT5, cTrader, and TradingView feeds at sub-millisecond latency.
- Slippage & Gap Simulation: During violent trend reversals, institutional liquidity thins rapidly. LaunchPropFirm includes customizable slippage and spread expansion simulation engines that accurately model live interbank execution conditions.
- Syndicate & Copy-Trading Detection: When multiple accounts enter identical reversal orders at the exact same millisecond, the platform flags the cluster for syndicate copy-trading, protecting firm capital reserves from predatory latency arbitrage.
- Reserve Fund Solvency: Modern prop firm operators maintain a 3.0x liquid reserve buffer to honor trader payouts smoothly when disciplined traders capture large 1:5 R:R reversal moves.
To explore the full economic blueprint of launching and managing an independent prop firm brand for under $3,000, review our prop firm source code and compare operational costs against legacy SaaS platforms in our platform comparison guide.
11. The Newbie's 5-Point Pre-Trade Reversal Checklist
Before clicking BUY on any currency pair or funded prop evaluation, run through this non-negotiable mental checklist:
- [ ] 1. Liquidity Grab Check: Did the market sweep a significant swing low to absorb sell stops first?
- [ ] 2. Lower High Identification: Have you clearly identified the exact price line of the Last Protected Lower High?
- [ ] 3. Candle Body Invariant: Has a full candlestick body closed completely above that Lower High on the 15-minute or 1-hour chart (zero naked wick guesses)?
- [ ] 4. Pullback Discipline: Are you waiting for a retest into discount demand rather than chasing the top of a green breakout candle?
- [ ] 5. Dynamic Lot Sizing: Did you enter your exact stop-loss pips into our free lot size calculator to ensure you risk strictly 0.5% or 1.0% of your account?
If all five boxes are checked, you have a high-probability institutional setup with asymmetric reward potential. If even one box is unchecked, keep your hands off the mouse.
Frequently Asked Questions About Forex Trend Reversals
When does a bearish market become bullish in forex?
A bearish market officially becomes bullish when price breaks above the last protected Lower High (LH) that created the lowest swing low, and a candlestick solid body closes completely above that level on your operational timeframe. This confirms a Market Structure Shift (MSS) or Change of Character (CHoCH). The reversal is further solidified when price pulls back to form a Higher Low (HL) and expands to a Higher High (HH).
What is the difference between a CHoCH and a BOS?
A Break of Structure (BOS) confirms the continuation of the prevailing trend (such as breaking another lower low in a downtrend). A Change of Character (CHoCH) marks the initial reversal warning, where price breaks the structural point of the opposite trend (such as breaking a lower high in a downtrend). BOS signals trend continuation, while CHoCH signals trend transition.
Why is a candle body close required to confirm a reversal?
A candle body represents the consensus price where institutional buyers and sellers agreed to close the timeframe interval. A wick merely indicates that price traded at that level temporarily before aggressive counter-orders pushed it back. In forex, naked wicks that breach lower highs are frequently liquidity sweeps designed to trap retail breakout buyers before resuming the downtrend.
Can a bearish market reverse without sweeping liquidity first?
While occasional V-shaped reversals occur during sudden geopolitical breaking news, more than 85% of institutional forex reversals are preceded by a sell-side liquidity sweep below the lowest swing low. Institutional participants require substantial volume to accumulate long positions, and sweeping retail stop losses below major lows provides the necessary liquidity.
Which timeframe is best for identifying forex trend reversals?
For day trading and prop firm evaluations, the 15-minute and 1-hour timeframes offer the ideal balance between structural reliability and risk-reward ratio. Lower timeframes (such as 1-minute or 5-minute) produce high rates of false-positive breaks due to algorithmic market-making noise, while higher timeframes (Daily and 4-Hour) provide macro directional context.
What is an institutional Demand Order Block in a reversal?
An institutional Demand Order Block is the last bearish candlestick printed immediately before the aggressive upward displacement that broke the protected lower high. It marks the price zone where institutional buyers entered massive buy volume. When price pulls back to this zone, it frequently bounces as institutions defend their entries and fill remaining buy orders.
How should a trader set stop loss on a reversal entry?
Place your protective stop loss 3 to 5 pips below the lowest swing low of the reversal setup. If price violates that swing low, your structural thesis is invalidated, and remaining in the trade violates institutional risk management. Never move your stop loss further away or trade without a hard stop in the market.
What is an asymmetric Risk-to-Reward ratio in reversal trading?
An asymmetric Risk-to-Reward ratio means your potential reward is significantly larger than your risked capital (typically 1:3.0 or higher). In reversal setups, entering at a refined 15-minute Demand Block with a 15-pip stop loss to target a 60-pip macro swing high yields a 1:4 R:R. This mathematical asymmetry allows you to maintain overall profitability even with a modest 40% win rate.
How does news trading impact bearish to bullish reversals?
Major macroeconomic announcements (such as US CPI, FOMC, or NFP) act as catalysts that accelerate trend reversals. However, trading the immediate second of news release is dangerous due to spread widening and negative slippage. Professional traders wait for the initial news volatility to sweep liquidity, confirm the candle body close on the 15-minute chart, and enter on the subsequent pullback.
Where can I practice identifying market structure reversals?
Begin by testing your ability to identify protected lower highs and candle body closes on historical TradingView charts across EUR/USD, GBP/USD, and USD/JPY. Use our free lot size calculator and pass probability calculator to simulate your risk management before attempting a funded prop challenge from our cheapest prop firm challenges directory.
Evaluate Your Prop Firm Readiness Score (0-100)
Answer 5 quick operational questions about your acquisition channels, runway, and engine tech to get a personalized launch roadmap.

M.Haris
Founder & Platform ArchitectBuilding open prop trading software infrastructure for operators worldwide
I built LaunchPropFirm to give forex educators, trading communities, and fintech operators complete ownership of their platform with full source code and zero monthly SaaS rent. Every article on this blog is drawn from hands-on platform development, live MT5 risk bridge mechanics, and real operator economics.
All content, financial models, ROI estimates, and architecture guides on LaunchPropFirm are published strictly for educational and informational purposes. LaunchPropFirm provides institutional prop trading software and technology infrastructure; it does not operate as a broker, custodian, or registered investment advisor.
Evaluation challenges and funded trader accounts referenced in this guide operate in simulated demo trading environments using real-time market data feeds. Simulated trading results do not represent actual trading performance or financial advice.
Recommended Next Reads
Hand-picked operator guides to scale your prop trading platform.
Forex Trading for Beginners PDF (Free 2026 Starter Guide)
Download the free forex trading for beginners PDF guide. Master currency pairs, pip math, lot sizing, risk rules, and funded trader evaluation roadmaps.
High Leverage Forex Brokers (2026 Risk & Comparison Matrix)
Compare high leverage forex brokers in 2026. Review 1:500 vs 1:30 limits, offshore B-book margin risks, spread traps, and funded account alternatives.
Skip the monthly fees
Own your prop firm platform outright. One time purchase.
Full source code. Live in 7 days. No revenue share. No monthly SaaS bill. See the exact platform before paying anything.
Demo login: haris / asdf1122. No signup needed